Download
1 / 1
10 likes | 90 Views
A02: Quantitative and qualitative differences in microbial DNA extracted from California soils using three common DNA extraction methods E. BENT 1 , R. FISCHER 2 , J.O. BECKER 2 and J. BORNEMAN 1

E N D
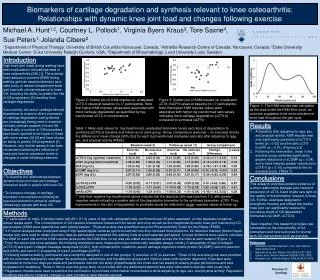
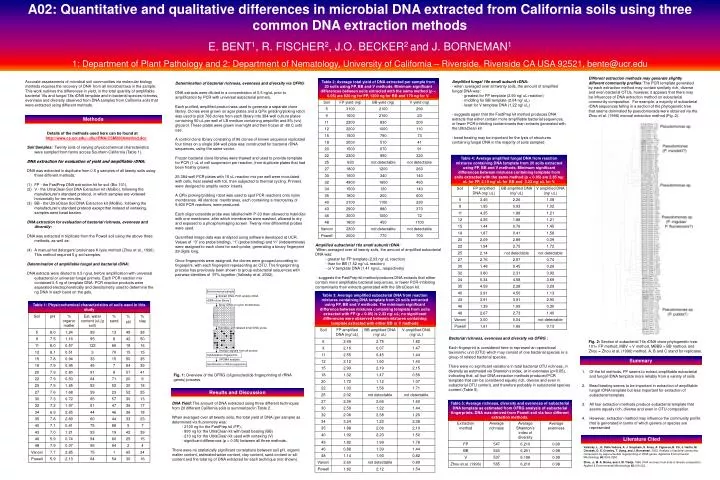
A02: Quantitative and qualitative differences in microbial DNA extracted from California soils using three common DNA extraction methods E. BENT1, R. FISCHER2, J.O. BECKER2 and J. BORNEMAN1 1: Department of Plant Pathology and 2: Department of Nematology, University of California – Riverside, Riverside CA USA 92521, bente@ucr.edu Different extraction methods may generate slightly different community profiles: The PCR template generated by each extraction method may contain similarly rich, diverse and even bacterial OTUs, however, it appears that there may be influences of DNA extraction method on eubacterial community composition. For example, a majority of eubacterial rDNA sequences falling in a section of the phylogenetic tree that seems dominated by pseudomonads were obtained via the Zhou et al. (1996) manual extraction method (Fig. 2). Accurate assessments of microbial soil communities via molecular biology methods requires the recovery of DNA from all microbial taxa in the sample. This work outlines the differences in yield, in the total quantity of amplifiable bacterial 16s and fungal 18s rDNA template and in bacterial species richness, evenness and diversity observed from DNA samples from California soils that were extracted using different methods. • Amplified fungal 18s small subunit rDNA: • when averaged over all twenty soils, the amount of amplified fungal DNA was: • greatest for FP template (2.90 ng/ uL reaction) • middling for BB template (2.04 ng/ uL) • least for V template DNA (1.22 ng/ uL) • - suggests again that the FastPrep kit method produces DNA extracts that either contain more amplifiable bacterial sequences, or fewer PCR-inhibiting contaminants than extracts generated with the UltraClean kit • bead beating may be important for the lysis of structures containing fungal DNA in the majority of soils sampled. Table 2: Average total yield of DNA extracted per sample from 20 soils using FP, BB and V methods. Minimum significant differences between soils extracted with the same method (p < 0.05) are 920 ng for FP, 1200 ng for BB and 170 ng for V. Determination of bacterial richness, evenness and diversity via OFRG: DNA extracts were diluted to a concentration of 0.5 ng/uL prior to amplification by PCR with universal eubacterial primers. Each purified, amplified product was used to generate a separate clone library. Clones were grown on agar plates and a QPix gridding/picking robot was used to pick 768 clones from each library into 384 well culture plates containing 50 uL per well of LB medium containing ampicillin and 8% (v/v) glycerol. These plates were grown overnight and then frozen at -80 C until use. A control clone library consisting of 96 clones of known sequence replicated four times on a single 384 well plate was constructed for bacterial rDNA sequences, using the same vector. Frozen bacterial clone libraries were thawed and used to provide template for PCR (1 uL of cell suspension per reaction, from duplicate plates that had been freshly grown). 25 384-well PCR plates with 15 uL reaction mix per well were inoculated with cells, heat sealed with foil, then subjected to thermal cycling. Primers were designed to amplify vector inserts. A QPix picking/gridding robot was used to spot PCR reactions onto nylon membranes. 48 identical membranes, each containing a macroarray of 9,600 PCR reactions, were produced. Each oligonucleotide probe was labelled with P-33 then allowed to hybridize with one membrane, after which membranes were washed, allowed to dry and exposed to a phosphoimaging screen. Twenty-nine differential probes were used. Quantified image data was analyzed using software developed at UCR. Values of “0” (no probe binding), “1” (probe binding) and “n” (indeterminate) were assigned to each clone for each probe, generating a binary fingerprint 29 digits long. Once fingerprints were assigned, the clones were grouped according to fingerprint, with each fingerprint representing an OTU. The fingerprinting process has previously been shown to group eubacterial sequences with pairwise identities of 97% together (Valinsky et al. 2002). Methods • Details of the methods used here can be found at http://www.cs.ucr.edu/~zliu/rRNA/CSM2004method.doc • Soil Samples: Twenty soils of varying physicochemical characteristics were sampled from farms across Southern California (Table 1). • DNA extraction for evaluation of yield and amplifiable rDNA: • DNA was extracted in duplicate from 0.5 g samples of all twenty soils using three different methods: • FP - the FastPrep DNA extraction kit for soil (Bio 101), • V - the UltraClean Soil DNA Extraction kit (MoBio), following the manufacturer’s standard protocol, in which samples are vortexed horizontally for ten minutes • BB - the UltraClean Soil DNA Extraction kit (MoBio), following the manufacturer’s standard protocol except that instead of vortexing, samples were bead beaten. • DNA extraction for evaluation of bacterial richness, evenness and diversity: • DNA was extracted in triplicate from the Powell soil using the above three methods, as well as: • A manual hot detergent/ proteinase K lysis method (Zhou et al., 1996). This method required 5 g soil samples. • Determination of amplifiable fungal and bacterial rDNA: • DNA extracts were diluted to 0.5 ng/uL before amplification with universal eubacterial or universal fungal primers. Each PCR reaction mix contained 0.5 ng of template DNA. PCR reaction products were separated electrophoretically and densitometry used to determine the ng DNA in each band on the gels. Table 4: Average amplified fungal DNA from reaction mixtures containing DNA template from 20 soils extracted using FP, BB and V methods. Minimum significant differences between mixtures containing template from soils extracted with the same method (p < 0.05) are 2.65 ng/ uL for FP, 2.19 ng/ uL for BB and 3.23 ng/ uL for V. • Amplified eubacterial 16s small subunit rDNA: • When averaged over all twenty soils, the amount of amplified eubacterial DNA was: • greater for FP template (2.03 ng/ uL reaction) • than for BB (1.52 ng/ uL reaction) • or V template DNA (1.41 ng/uL, respectively) • - suggests the FastPrep kit method produces DNA extracts that either contain more amplifiable bacterial sequences, or fewer PCR-inhibiting contaminants than extracts generated with the UltraClean kit. Environmental sample Table 3: Average amplified eubacterial DNA from reaction mixtures containing DNA template from 20 soils extracted using FP, BB and V methods. The minimum significant difference between mixtures containing template from soils extracted with FP (p < 0.05) is 2.33 ng/ uL; no significant differences were observed between mixtures containing template extracted with either BB or V methods Extract DNA, PCR amplify rDNA rDNA clone library Array rDNA on nylon membranes Hybridize with labeled small DNA probe Bacterial richness, evenness and diversity via OFRG: Each fingerprint is considered here to represent an operational taxonomic unit (OTU) which may consist of one bacterial species or a group of related bacterial species. There were no significant variations in total bacterial OTU richness, in diversity as estimated via Shannon’s index, or in evenness (p<0.05), indicating that, all four DNA extraction methods produced PCR template that can be considered equally rich, diverse and even in eubacterial OTU content, and therefore probably in eubacterial species content (Table 5). Fig. 2: Section of eubacterial 16s rDNA clone phylogenetic tree. 101= FP method, MBV = V method, MBBB = BB method, and Zhou = Zhou et al. (1996) method. A, B and C stand for replicates. Analyze signals from all probes Hybridization fingerprints Summary UPGMA analysis Identification of Microorganisms • Of the kit methods, FP seems to extract amplifiable eubacterial and fungal rDNA template more reliably from a variety of soils • Bead beating seems to be important in extraction of amplifiable fungal rDNA template but less important for extraction of eubacterial template • All four extraction methods produce eubacterial template that seems equally rich, diverse and even in OTU composition • However, extraction method may influence the community profile that is generated in terms of which genera or species are represented Fig. 1: Overview of the OFRG (oligonucleotide fingerprinting of rRNA genes) process. Results and Discussion • DNA Yield: The amount of DNA extracted using three different techniques from 20 different California soils is summarized in Table 2. • When averaged over all twenty soils, the total yield of DNA (per sample) as determined via fluorometry was: • 2100 ng for the FastPrep kit (FP), • 890 ng for the UltraClean kit with bead beating (BB) • 210 ng for the UltraClean kit used with vortexing (V) • significant differences (p < 0.05) between all three methods. • There were no statistically significant correlations between soil pH, organic matter content, estimated water content, clay content, sand content or silt content and the total ng of DNA extracted for each technique (not shown). Table 5: Average richness, diversity and evenness of eubacterial DNA template as estimated from OFRG analysis of eubacterial fingerprints. DNA was derived from Powell soil via four different extraction methods. Literature Cited Valinsky, L., G. Della Vedova, A. J. Scupham, S. Alvey, A. Figueroa, B. Yin, J. Hartin, M. Chrobak, D. E. Crowley, T. Jiang, and J. Borneman. 2002. Analysis of bacterial community composition by oligonucleotide fingerprinting of rRNA genes. Applied & Environmental Microbiology 68:3243-3250. Zhou, J., M. A. Bruns, and J. M. Tiedje. 1996. DNA recovery from soils of diverse composition. Applied & Environmental Microbiology 62:316-322.