Download
1 / 1
20 likes | 122 Views
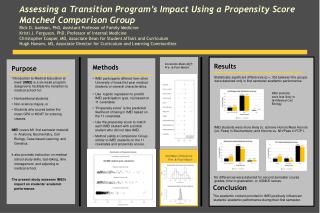
IDP Statistical Assessment of Lejweleputswa Municipalities Moses Nqana Statistics South Africa, Free State Province. Introduction. Methods. Conclusion.

E N D
IDP Statistical Assessment of Lejweleputswa Municipalities Moses NqanaStatistics South Africa, Free State Province Introduction Methods Conclusion The 2011/12 IDPs for Lejweleputswa District Municipality and Matjhabeng, Nala, Tokologo, Masilonyana, and Tswelopele Local Municipalities were assessed. The assessment entail examination of standard 73 clusters of development indicators ranging from demographic, socio-economic to governance and financial viability of the municipalities. The following aspects were considered: Indicator use (quantified indicator), Data source (source used for an indicator), and Time series (number of data points). During the assessment, codes as reflected in Table 1 were allocated to applicable criteria and captured on pre-calculated excel template which eventually generated outcomes based on indicator use, indicator source as well as indicator series. Table 1: Assessment criteria codes The Integrated Development Plans (IDP) developed by municipalities is the tool that should be used to ensure the sustainable development of both urban and rural areas through combating service-delivery backlogs and also high levels of unemployment and poverty(Local Government: Municipal Planning and Performance Management Regulations, 2001). One key challenge as cited by Marie (2007:13) is that, historically, South African local authorities were not sustainable or economically viable and that the level of service delivery in township areas is “appalling. Poverty remains widespread and persists alongside affluence, while inequalities are increasing. Municipalities require data and information for planning, decision-making and monitoring of social and economic development and change. This study explores the use of developmental indicators in the IDPs Lejweleputswa District Municipality and its five local municipalities (Matjhabeng, Nala, Tokologo, Masilonyana and Tswelopele) in order to demonstrate the use of development indicators and availability of information in the IDPs. The study further presents an assessment of the findings and makes recommendations. The above analyses shows that the current use of development indicators in IDPs is too limited to (a) inform and guide policy formulation; and (b) targeted allocation of resources at a local government level. Considering the various types of development indicators highlighted in the study, it is evident that very few of these were utilised in the IDPs and the usage of zero to one data points as a tool meant for monitoring of municipal performance is compromised, as reflected in Figure 2 and 4 respectively. The challenge for Lejweleputswa municipality is probably the availability and accessibility of up-to-date information. In most instances, municipalities rely on Statistics South Africa’s (Stats SA) Census Results – either those of 1996 or those of 2001 - as the basis for most of their indicators (Figure 3). Consequently, the inadequate use of development indicators in IDPs has several implications for development planning and, therefore, also for local governance. All in all, the capacity of municipal officials and councillors needs to be enhanced with regard to the importance and the use of development indicators, presentation of statistical information and interpretation when developing IDP documents. It is therefore critical that officials should be trained in statistical literacy as this will further improve the knowledge and their application of such skills in IDP development. It is envisaged that the current partnership between Stats SA and the Free State local government will bring about improvements in the use of statistical information in the IDP development and increased availability of information to meet local planning statistical needs. Results /Findings • Figure shows that, out of the 73 indicators considered: • Tswelopele local municipality showed the highest level of indicator use (68%) compared to other municipalities. • Nala was found to have the lowest (13 %) levels of indicator use. • Matjhabeng, Masilonyane, Tokologo and Lejweleputswa’s use of indicators in their IDPs was below recorded a percentage below 40%. References In all municipalities a large percentage of indicators did not have their sources referenced. This percentage ranged from 71% for Masilonyana to about 88% for Tswelopele and Nala. All municipalities used Stats SA as their source of data, with the highest use (29%) in Masilonyane. Only Masilonyane, Nala and Matjhabeng had Statistics SA as their frequently used source. Marie, F. 2007. The effectiveness of Integrated Development Plans in The Free State. [Online] Available: www.ufs.ac.za South Africa. 2000. Local Government: Municipal Systems Act, No. 32, 2000. Government Gazette, Vol. 425, No. 21776, 20 November 2000. [Online] Available: www.info.gov.za South Africa. 2001. Local Government: Municipal Planning and Performance Management Regulations. Government Gazette, Vol.434, No. 22605, 24August 2001. [Online] Available: www.info.gov.za Figure 1: Lejweleputswa District Municipality Objectives Acknowledgements The objective of this study is to analyse the use of development indicators in the IDP process, and to determine the implication of the latter in development planning and local governance as well as to the examine the statistical gaps, in terms of capacity, quality and information inherent in the IDP development. Mr S. Musapelo, Lejweleputswa District IDP Officer; Mr J. Jasone, Nala IDP Manager; Mr L. Thabana, Matjhabeng IDP Manager; Mr K. Khumalo, Masilonyana IDP Manager; Mr Nkwadipo, Tokologo IDP Manager; and Mr D. Rampai, Tswelopele IDP Manager for the copy of IDP documents Figure 4 shows time series data use. It is acknowledged that some phenomena might not necessarily need comparison over time. Zero point indicated cases in which there were no indicators used. For Matjhabeng in 17% of the indicators used, there were two data points used. There were very few cases in which three or more points were used.