Download
1 / 17
170 likes | 243 Views
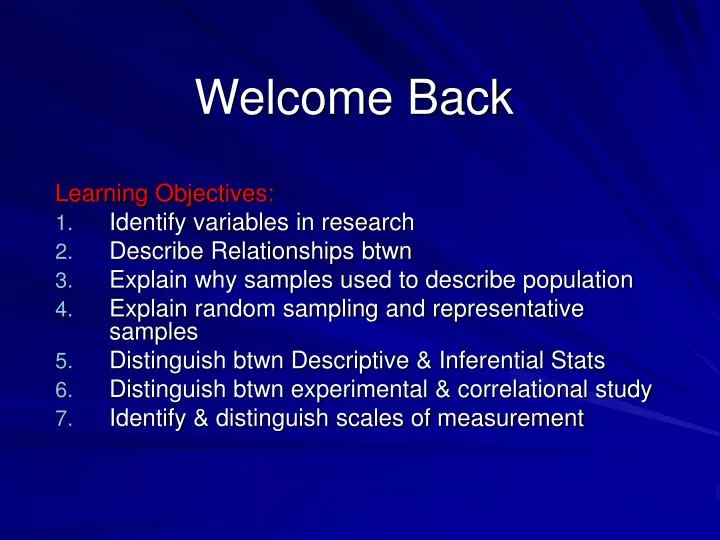
Welcome Back. Learning Objectives: Identify variables in research Describe Relationships btwn Explain why samples used to describe population Explain random sampling and representative samples Distinguish btwn Descriptive & Inferential Stats

E N D
Welcome Back Learning Objectives: Identify variables in research Describe Relationships btwn Explain why samples used to describe population Explain random sampling and representative samples Distinguish btwn Descriptive & Inferential Stats Distinguish btwn experimental & correlational study Identify & distinguish scales of measurement
Research Process • Interest in something • “Playing video games leads to violence” • Goal: Discover LAWS OF NATURE • “Somethings” are called Variables • Variables • Independent variables- the “thing” that influences the behavior • Dependent variables- the outcome or result of the independent variable
Independent Vegetables Vitamins Drugs Smiling Examples? Dependent Cancer Immune System Alzheimers Helping or Altruism Examples? Examples of Variables
Relationship between Variables • Relationship: occurs when a chg in one var. is accompanied by a consistent chg. in another var. • Strength: Degree of chg in X is associated with chg in Y • Types of relationships: • Increase, increase • Increase, decrease • Decrease, decrease • Zero
Population-all members of group Parameters-numbers that describe Sample-subset of pop designed to be representative Statistic-numbers that describe Populations & Samples Every student at BC Students in a History class at BC
http://www.ruf.rice.edu/~lane/stat_sim/sampling_dist/ • Why? • Cheaper • Practical • Representative
What is “done” to samples? • Describe • Use descriptive statistics to organize & summarize characteristics of data • Example: The average test score was 87% • Infer • Use inferential statistics to decide whether sample data represents a particular relationship in population • Example: Reading the textbook significantly increased test scores.
Characteristics of a Study • Question about characteristic of sample or pop is asked • Design study to answer question • Who -How many -When -What • Conduct study • Correlational • Experimental
Correlational Study • Goal: To determine if relationship btwn two or more var is present • No variables are manipulated or made to occur, they are simply measured • As such cannot infer causality • Can’t say X causes Y • Only X and Y are related
Ice Cream Sales Temperature Example • Researcher’s Question: -Is there a relationship btwn ice cream sales and crime rate? • Design of study: measure sales & crime rates • Yes, a positive, strong relationship is present • Doesn’t mean ice cream causes crime
Experimental Study • Goal: To determine if relationship (causality) exists btwn variables • Variable (indep) are manipulated or changed to see chg in beh (dep var) • Can *infer causality • X causes chg in Y • *Caution: causal statement based on probability • Never says PROVES • Other variables could be responsible for change in dependent variable
Number of Crimes Committed 0 1 2 Scoops of Ice Cream Example • Researcher’s Question: -Does ice cream cause or have an effect on criminal behavior • Design of study: P’s in diff conditions of ice cream (levels of indep var) and measure criminal beh (dep var) • Yes, a probable causal relationship is present • P’s that ate 1 or 2 scoops of ice cream committed more crimes • PROBABILITY
Type of Data or Characteristics of Scores • Type of data or dependent var you’re interested in will determine what statistic you can use • Numbers you record have diff mathematical characteristics • Characteristics of numbers • Levels of measurement • Continuous or discrete
Scales of Measurement • Nominal Scale: scores used for identification or naming. Ex: categories • Ordinal Scale: scores indicate rank or ordering. Ex: relative amount • Interval Scale: scores indicate actual amount. Ex: numbers • **0 doesn’t necessarily mean non • Ratio Scale: scores indicate actual amount Ex: numbers (0 actually means none)
Continuous or Discrete • Continuous: allows fractional amounts (continues btwn whole numbers) • Usually Scale (ratio & interval) • Test score 97.6 • IQ score 145.9 • Discrete: measures only whole numbers • Usually Nominal or Ordinal • Male or Female • Eye color • Can be Scale • Ice cream or no ice cream • No. of crimes 3
Questions? • Let’s get Active with a CLE • Homework: Finish Ch.1 & 2 study guid • Review notes & text • Finish Ch. 1 & 2 of study guide • Preview Ch. 3 • Bring • Questions, book, calculator, pencils • Be ready for quiz