Download
1 / 13
130 likes | 243 Views
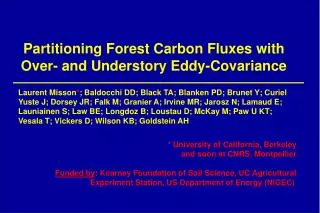
Meta-analysis of eddy covariance carbon fluxes data. Dario Papale, Markus Reichstein, Riccardo Valentini Marc Aubinet, Christian Bernhofer, Alessandro Cescatti, Alexander Knohl, Tuomas Laurila, Anders Lindroth, Eddy Moors, Kim Pilegaard, Günther Seufert. ?. + Disturbances. Climate, soil.

E N D
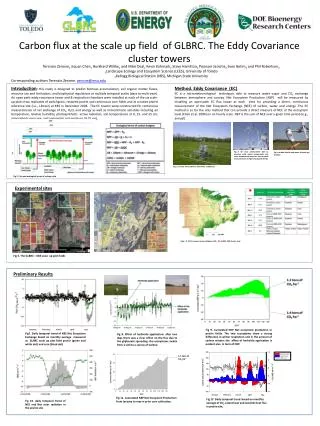
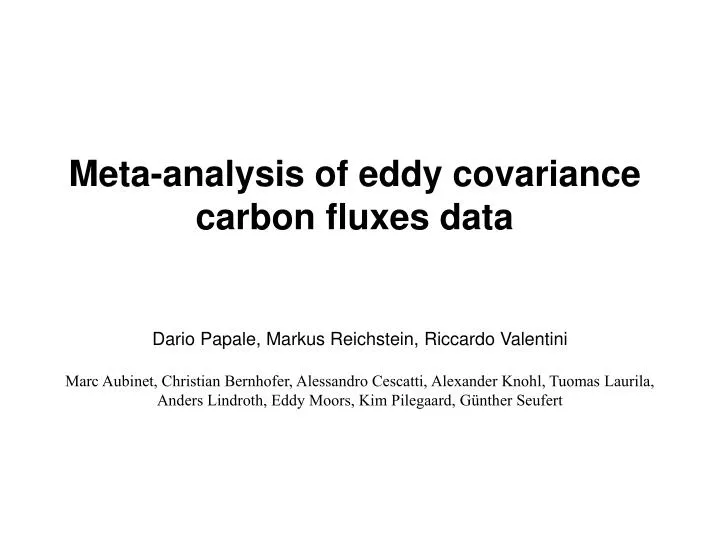
Meta-analysis of eddy covariance carbon fluxes data Dario Papale, Markus Reichstein, Riccardo Valentini Marc Aubinet, Christian Bernhofer, Alessandro Cescatti, Alexander Knohl, Tuomas Laurila, Anders Lindroth, Eddy Moors, Kim Pilegaard, Günther Seufert
? + Disturbances Climate, soil Schulze et al. 2000
Pot. Rad. > 8.8 TJ m-2 y-1 Pot. Rad. < 8.8 TJ m-2 y-1 IWA (Index Water Availability): ratio of actual and potential evapotranspiration MAT: Mean annual temperature The data set was split into two populations by a threshold of potentially available radiation energy of 8.8 TJ m-2 yr-1 (52°N)
Pot. Rad. > 8.8 TJ m-2 y-1 Pot. Rad. < 8.8 TJ m-2 y-1
Best-fit modeled versus observed annual (a) GPP, (b) TER, (c) NEP
How do we chose the radiation threshold? Performance of the simple regression model
Are the results robust against errors? (advection, footprint, quality, gapfilling, partitioning…) Results from 500 Monte-Carlo simulations where randomly plus or minus 200 gC m-2 were added to GPP, TER and NEP
Decomposition = enzymatic process that follows Michaelis-Menten kinetics (1913) At high [S], Km = insignificant and Q10 of R = Q10 of Vmax (Arrhenius kinetics) At low [S] : Km becomes important Also Km increases with Temp At low [S]: Q10 of R << Q10 of Vmax Davidson et al., Global Change Biology, in press Thanks Ivan for the slide!
Apparent Q10 depends on soil moisture In opposite direction of what models predict Under ‘standard’ conditions (15°C; RSWC=0.6) the emergent Q10 of model and data are similar Along decreasing/increasing water availability data and model behave completely differently with respect to how Q10 changes.
Latuitude - NEE relation Valentini et al. 2000
Conclusions • GPP and TER compensate each other canceling out single climate factor effects • Water availability plays an important role in GPP and TER not only in the Mediterranean region but also in central Europe • Ecosystem carbon balance modeling approaches should abandon the convenient climate-NPP analogy and better account for carbon-water cycle interactions and non-climatic factors affecting respiration • Flux tower data are a unique source of information that play an important role in process understanding and model development