Download
1 / 1
10 likes | 87 Views
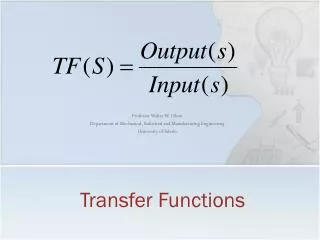
NEW TRANSFER FUNCTIONS FOR CORRECTING EDDY COVARIANCE FLUXES OF WATER VAPOUR. A. De Ligne, B. Heinesch, M. Aubinet Unité de Physique des Biosystèmes, Faculté Universitaire des Sciences Agronomiques de Gembloux, Belgium. INTRODUCTION. OBJECTIVES.

E N D
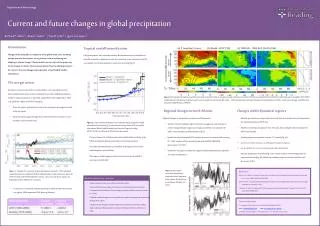
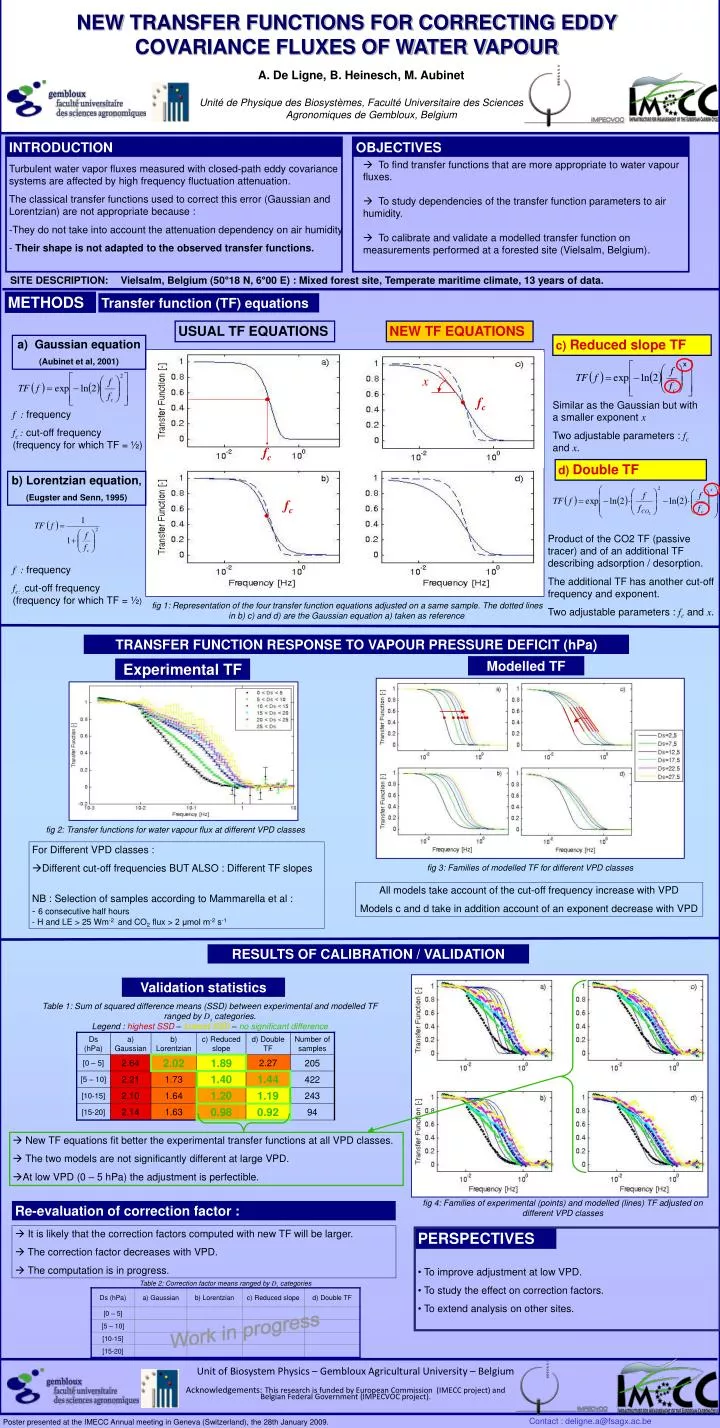
NEW TRANSFER FUNCTIONS FOR CORRECTING EDDY COVARIANCE FLUXES OF WATER VAPOUR A. De Ligne, B. Heinesch, M. Aubinet Unité de Physique des Biosystèmes, Faculté Universitaire des Sciences Agronomiques de Gembloux, Belgium INTRODUCTION OBJECTIVES • To find transfer functions that are more appropriate to water vapour fluxes. • To study dependencies of the transfer function parameters to air humidity. • To calibrate and validate a modelled transfer function on measurements performed at a forested site (Vielsalm, Belgium). Turbulent water vapor fluxes measured with closed-path eddy covariance systems are affected by high frequency fluctuation attenuation. The classical transfer functions used to correct this error (Gaussian and Lorentzian) are not appropriate because : • They do not take into account the attenuation dependency on air humidity • Their shape is not adapted to the observed transfer functions. SITE DESCRIPTION: Vielsalm, Belgium (50°18 N, 6°00 E) : Mixed forest site, Temperate maritime climate, 13 years of data. METHODS Transfer function (TF) equations USUAL TF EQUATIONS NEW TF EQUATIONS c) Reduced slope TF • Gaussian equation (Aubinet et al, 2001) x fc Similar as the Gaussian but with a smaller exponent x Two adjustable parameters : fc and x. f : frequency fc : cut-off frequency (frequency for which TF = ½) fc d) Double TF b) Lorentzian equation, (Eugster and Senn, 1995) fc Product of the CO2 TF (passive tracer) and of an additional TF describing adsorption / desorption. The additional TF has another cut-off frequency and exponent. Two adjustable parameters : fc and x. f : frequency fc: :cut-off frequency (frequency for which TF = ½) fig 1: Representation of the four transfer function equations adjusted on a same sample. The dotted lines in b) c) and d) are the Gaussian equation a) taken as reference. TRANSFER FUNCTION RESPONSE TO VAPOUR PRESSURE DEFICIT (hPa) Modelled TF Experimental TF fig 2: Transfer functions for water vapour flux at different VPD classes For Different VPD classes : • Different cut-off frequencies BUT ALSO : Different TF slopes NB : Selection of samples according to Mammarella et al : - 6 consecutive half hours - H and LE > 25 Wm-2 and CO2 flux > 2 μmol m-2 s-1 fig 3: Families of modelled TF for different VPD classes All models take account of the cut-off frequency increase with VPD Models c and d take in addition account of an exponent decrease with VPD RESULTS OF CALIBRATION / VALIDATION Validation statistics Table 1: Sum of squared difference means (SSD) between experimental and modelled TF ranged by Ds categories. Legend : highest SSD – lowest SSD – no significant difference • New TF equations fit better the experimental transfer functions at all VPD classes. • The two models are not significantly different at large VPD. • At low VPD (0 – 5 hPa) the adjustment is perfectible. Fig 6: Average of experimental TF and modelled TF by Ds categories fig 4: Families of experimental (points) and modelled (lines) TF adjusted on different VPD classes Re-evaluation of correction factor : • It is likely that the correction factors computed with new TF will be larger. • The correction factor decreases with VPD. • The computation is in progress. PERSPECTIVES • To improve adjustment at low VPD. • To study the effect on correction factors. • To extend analysis on other sites. Table 2: Correction factor means ranged by Ds categories Work in progress Unit of Biosystem Physics – Gembloux Agricultural University – Belgium Acknowledgements: This research is funded by European Commission (IMECC project) and Belgian Federal Government (IMPECVOC project). Contact : deligne.a@fsagx.ac.be Poster presented at the IMECC Annual meeting in Geneva (Switzerland), the 28th January 2009.