Download
1 / 12
120 likes | 292 Views
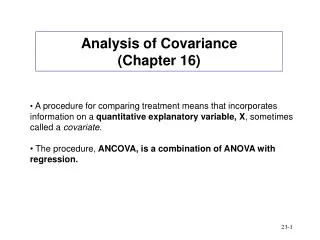
Analysis of Covariance (ANCOVA) Analysis of variance conducted after removing the relationship of some extraneous variable (covariate) with the dependent variable (Y) What variability in DV can be explained by IV, AFTER removing variability explained by the covariate?.

E N D
Analysis of Covariance (ANCOVA) Analysis of variance conducted after removing the relationship of some extraneous variable (covariate) with the dependent variable (Y) What variability in DV can be explained by IV, AFTER removing variability explained by the covariate?
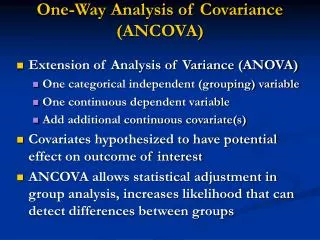
Reasons for Using ANCOVA 1. reduce ‘error’ (MSW) by removing effects of extraneous variable 2. adjust DV scores, what would they be in the absence of the covariate (estimated through regression)
Ideally small number of covariates each correlated with the DV uncorrelated with each other
Analysis of Covariance (ANCOVA) Example – even after ‘randomly assigning’ participants to levels of the IV, some differences still exist before IV is introduced. See example on next slide of ‘anxiety’ differences before any exposure to anxiety stimulus or any ‘treatment’ manipulation
Regression is used to adjust the DV scores Adjusted scores reflect the removal of the variability in the DV explained by the Covariate what would Anxiety at time 3 be, when Anxiety at time 1 is held constant? The regression residuals reflect variability not explained by the covariate – it becomes the ‘error’ (MSW) term and will be lower than the MSW would have been
Differences among the adjusted means (MSB) can be evaluated relative to the unexplained variance that remains after removal of the relationship of the DV with the covariate What is IV – DV relationship after removing the Covariate – DV relationship
The adjusted scores of the DV are based on a regression equation using the pooled regression coefficient pooled across the separate regression equations for each group in the design. Thus, for each group the regression coefficient is the same, but the intercepts will vary (graph to follow)
1 1 1 Original mean 2 1 2 1 Adjusted mean 2 DV (Y) 1 2 3 3 Slopes the same, intercepts differ 2 2 3 3 3 Mean of Covariate 3 Group means are adjusted to what they would be at mean of covariate Covariate
Assumptions for ANCOVA Same as those for ANOVA, plus Homogeneity of regression coefficients since use ‘pooled’ estimate of regression coefficient Linear relationship of DV with Covariate since using linear regression to adjust scores on DV
What to report Original Means and Standard Deviations Adjusted Means For multilevel variable use pairwise comparisons option, not post hoc
Adjusted Means and SEs Original Means and SDs ANOVA Without Covariate ANOVA With Covariate MSW reduced due to covariate MSB reduced due to covariate