Download
1 / 1
20 likes | 174 Views
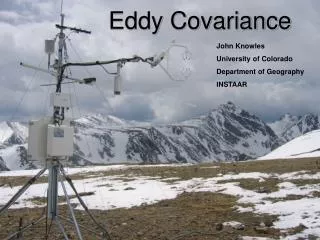
1.1 tons of CO 2 ha -1. Carbon flux at the scale up field of GLBRC. The Eddy Covariance cluster towers. Terenzio Zenone 1 Jiquan Chen 1 Burkhard Wilske 1 and Mike Deal 1 Kevin Kahmark 2 Steve Hamilton 2 Poonam Jasrotia 2 Sven Bohm 2 and Phil Robertson 2

E N D
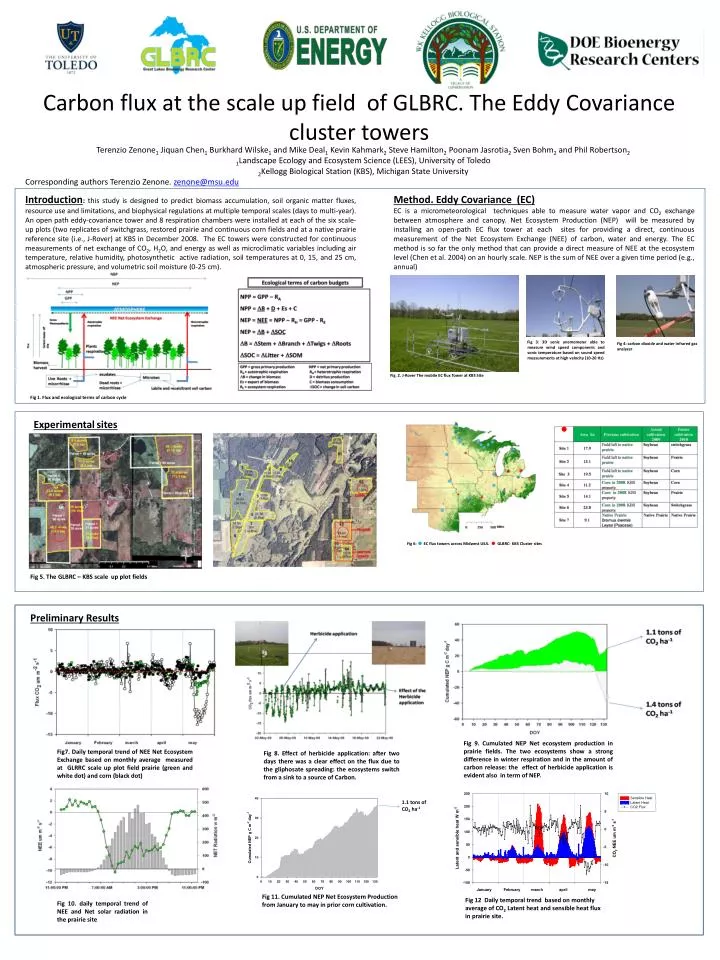
1.1 tons of CO2 ha-1 Carbon flux at the scale up field of GLBRC. The Eddy Covariance cluster towers Terenzio Zenone1 Jiquan Chen1 Burkhard Wilske1 and Mike Deal1 Kevin Kahmark2 Steve Hamilton2 Poonam Jasrotia2 Sven Bohm2 and Phil Robertson2 1Landscape Ecology and Ecosystem Science (LEES), University of Toledo 2Kellogg Biological Station (KBS), Michigan State University Corresponding authors Terenzio Zenone. zenone@msu.edu Introduction: this study is designed to predict biomass accumulation, soil organic matter fluxes, resource use and limitations, and biophysical regulations at multiple temporal scales (days to multi-year). An open path eddy-covariance tower and 8 respiration chambers were installed at each of the six scale-up plots (two replicates of switchgrass, restored prairie and continuous corn fields and at a native prairie reference site (i.e., J-Rover) at KBS in December 2008. The EC towers were constructed for continuous measurements of net exchange of CO2, H2O, and energy as well as microclimatic variables including air temperature, relative humidity, photosynthetic active radiation, soil temperatures at 0, 15, and 25 cm, atmospheric pressure, and volumetric soil moisture (0-25 cm). Method. Eddy Covariance (EC) EC is a micrometeorological techniques able to measure water vapor and CO2 exchange between atmosphere and canopy. Net Ecosystem Production (NEP) will be measured by installing an open-path EC flux tower at each sites for providing a direct, continuous measurement of the Net Ecosystem Exchange (NEE) of carbon, water and energy. The EC method is so far the only method that can provide a direct measure of NEE at the ecosystem level (Chen et al. 2004) on an hourly scale. NEP is the sum of NEE over a given time period (e.g., annual) Fig 3: 3D sonic anemometer able to measure wind speed components and sonic temperature based on sound speed measurements at high velocity (10-20 Hz) Fig 4: carbon dioxide and water infrared gas analyzer Fig. 2. J-Rover The mobile EC flux Tower at KBS Site Fig 1. Flux and ecological terms of carbon cycle Experimentalsites Fig 6: EC flux towers across Midwest USA. GLBRC- KBS Cluster sites Fig 5. The GLBRC – KBS scale up plot fields Preliminary Results Fig 9. Cumulated NEP Net ecosystem production in prairie fields. The two ecosystems show a strong difference in winter respiration and in the amount of carbon release: the effect of herbicide application is evident also in term of NEP. Fig7. Daily temporal trend of NEE Net Ecosystem Exchange based on monthly average measured at GLRRC scale up plot field prairie (green and white dot) and corn (black dot) Fig 8. Effect of herbicide application: after two days there was a clear effect on the flux due to the gliphosate spreading: the ecosystems switch from a sink to a source of Carbon. Fig 11. Cumulated NEP Net Ecosystem Production from January to may in prior corn cultivation. Fig 12 Daily temporal trend based on monthly average of CO2 Latent heat and sensible heat flux in prairie site. Fig 10. daily temporal trend of NEE and Net solar radiation in the prairie site