Download
1 / 49
490 likes | 584 Views
Current Trends in Image Quality Perception. Mason Macklem Simon Fraser University http://www.cecm.sfu.ca/~msmackle. General Outline. Examine model of human visual system (HVS) Examine properties of human perception of images consider top-down/bottom-up distinction

E N D
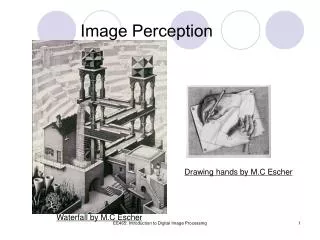
Current Trends in Image Quality Perception Mason Macklem Simon Fraser University http://www.cecm.sfu.ca/~msmackle
General Outline • Examine model of human visual system (HVS) • Examine properties of human perception of images • consider top-down/bottom-up distinction • Discuss combinations of current models, based on different perceptual phenomena
Pros: Very nice theoretically Clearly-defined notions of quality Based on theory of cognitive human vision Flexible for application-specific model Cons: Practical to implement? Subject-specific definition of quality Subjects more accurate at determining relative vs. absolute measurement Quality-based model
Based on properties of HVS Models eye’s reaction to various stimuli eg. mach band, sine grating, Gabor patch Assumes linear model to extend tests to complex images Based on properties of Human Attention Models subjects’ reactions to different types of image content eg. Complex, natural images Bypasses responses to artificial stimuli Perception vs Semantic Processing
Human Visual System Model • Breaks process of image-processing into interaction of contrast information with various parts of the eye • Motivates representation by discrete filters
Cornea and lens focus light onto retina • Retina consists of millions of rods and cones • rods: low-light vision • cones: normal lighting • rods:cones => 60:1 • Fovea consists of densely packed cones • processing focusses on foveal signals
Motivation for Frequency Response Model • Errors in image reconstruction are differences in pixel values • Interpreted visually as differences in luminance and contrast values (ie. physical differences) • Model visual response to luminance and localized contrast to predict visible errors • assuming linear system, measurable using response to simple phenomena
Visible Differences Predictor (VDP) Scott Daly
Contrast Sensitivity Function (CSF) • increasing frequency levels can be resolved to limited extent • CSF: represents limitations on detecting differences in increasing frequency stimuli • specific to given lens and viewing conditions • Derive by capturing images for increasing frequency gratings
Common Test Stimuli Sine grating Gabor patch Mach band
Some Common CSFs Daly’s CSF (VDP)
Cortex Transform • Used to simulate sensitivity of visual cortex to orientation and frequency • Splits frequency domain into 31 (?) sections, each of which is inverse transformed separately
Masking Filter • Nonlinear filter to simulate masking due to local contrast • function of background contrast • Masking calculated separately using reactions to sine grating and Gaussian noise • Uses learning model to simulate prediction of background noise • similar noise across images lessens overall effect
Probability Summation • Describes the increase in the probability of detection as the signal contrast increases • Calculates contrast difference between the two images, for each of the (31) images • In most cases, the signs will agree in every pixel for each cortex band • use the agreed sign as the sign of the probability • Overall probability is product over all (31) cortex transformed images • See book for example of Detection Map
Stimulus driven eg. Search based on motion, colour, etc. Useful for efficient search Attracted to objects rather than regions attention driven by object properties Task/motivation-based eg. Search based on interpreting content Not as noticeable during search Motivation-based search still shows effects of object properties Bottom-up vs. Top-down
Saccades & Drifts • Rapid eye movements • occur 2-3 times/second • HVS responds to changes in stimuli • Saccades: search for new ROI, or refocus on current ROI • Drifts: slow movement away from centre of ROI to refresh image on retina VeroniqueRuggirello
Influences of Visual Attention • Measured with visual search experiments • subjects search for target item from group • target item present in half of samples • Two measures: • Reaction Time: time to find object correctly vs. number of objects in set • Accuracy: frequency of correct response vs. display time of stimulus • Efficient test: reaction time independent of set size
Contrast EOS increases with increasing contrast relative to background
Size EOS increases as size difference increases
Location EOS increases when desired objects are located near center
Even when image content is not centrally located, natural tendency is to focus on center of image
Shape EOS increases as shape-difference “increases”
Spatial Depth EOS increases as spatial depth increases
Who is this guy? Where was this photo taken?
People Attention more sensitive to human shapes than inanimate objects
Complexity EOS increases as complexity of background decreases
Other features • Color: • EOS will increase as color-difference increases • Eg. Levi’s patch on jeans • Edges: • Edges attended more than textured regions • Predictability: • Attention directed towards familiar objects • Motion: • EOS will increase as motion-difference increases
Region-of-Interest Importance Map (ROI) • Visual attraction directed to objects, rather than regions • Treats image as a collection of objects • Weights error w/i objects according to various types of attentive processes • Results in Importance Map • Weights correspond to probability that location will be attended directly
Notes on ROI • VDP Detection Map: probability that existing pixel differences will be detected • ROI Importance Map: probability that existing visible pixel differences will be attended • Overall probability of detection should be a combination of both factors • Open question: single number for either model?