Download
1 / 41
420 likes | 662 Views
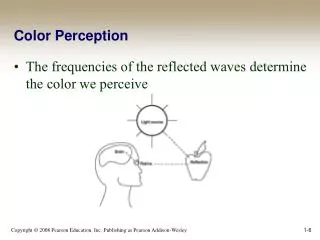
Image Perception and Color Space. Human Eye. Simultaneous Contrast. luminance vs. brightness Contrast Weber’s Law: . Mach Band. Lateral inhibition. Herman Grid. Blind Spot Test. Blind Spot Test. Blind Spot Test. Blind Spot Test. Color Representation. Visual Spectrum.

E N D
Simultaneous Contrast • luminance vs. brightness • Contrast • Weber’s Law:
Mach Band • Lateral inhibition
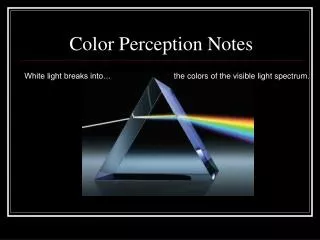
Visual Spectrum Blue 435.8 nm Green 546.1 nm Red 700 nm
CIE Color Chart CIE XYZ
YUV Color Space • Y is luminance of a color Y = 0.299*R’ + 0.587*G’ + 0.114*B’ • U and V are color differences U = 0.492*(B’-Y) V = 0.877*(R’-Y) • This simplifies recovery of R’,G’,B’ • R’ = Y - 1.140V • G’ = Y - 0.394U - 0.581V • B’ = Y + 2.032U
V U YIQ Color Space • Rotate UV vectors by 30o I Q
YIQ Color Space I = 0.736*(R’-Y) - 0.268(B’-Y) Q = 0.478*(R’-Y) + 0.413*(B’-Y) Recovery of R,G,B R’ = Y - 0.956*I + 0.620*Q G’ = Y - 0.272*I - 0.647*Q B’ = Y - 1.108*I - 1.705*Q
YCbCr • Scaled and offset version of YUV • Range of signals Y: 16~235 Cb,Cr: 16~240 • Suitable for digital images/video
YCbCr Color Space Begin by calculating R-Y and B-Y vectors B’-Y = -0.299*R’ - 0.587*G’ + 0.886*B’ R’-Y = 0.701*R’ - 0.587*G - 0.114*B’ The difference signals have ranges B’-Y (-.866 to .866) R’-Y (-.701 to .701) Scale to range (-.5 to .5) to give same range as Y (0 to 1) Cb = -.169*R’ - .331*G’ + .500*B’ = .564(B’-Y) Cr = .500*R’ - .419*G’ - .081*B’ = .713(R’-Y)
YCbCr Color Space For computer representation, Scale and offset these values to keep in range 16 to 240 (Cb and Cr) or 16 to 235 (Y) Cb = 224*Cb + 128 = 126.336(B’-Y) + 128 Cr = 224*Cr + 128 = 159.712(B’-Y) + 128 Y = 219*Y + 16 Finally,
CMYK Color Space • Subtractive color space • Most common use is for printers • K (black) is added for efficiency and consistency • White cannot be generated w/o white paper Example: Cyan represents green and blue, by adding cyan we subtract the color red from sum.