Download
1 / 32
490 likes | 1.21k Views
Credit Metrics. By: A V Vedpuriswar. November 11, 2010. Introduction. CreditMetrics ™ was launched by JP Morgan in 1997. It evaluates credit risk by predicting movements in the credit ratings of the individual investments in a portfolio. CreditMetrics consists of three main components:

E N D
Credit Metrics By: A V Vedpuriswar November 11, 2010
Introduction • CreditMetrics™ was launched by JP Morgan in 1997. • It evaluates credit risk by predicting movements in the credit ratings of the individual investments in a portfolio. • CreditMetrics consists of three main components: • Historical data sets • A methodology for measuring portfolio Value at Risk (VAR) • A software package known as CreditManager®
Transition Matrices and Probability of Default • CreditMetrics uses transition matrices to generate a distribution of final values for a portfolio. • A transition matrix reflects the probability of a given rating being upgraded or downgraded within a given time horizon. • Transition matrices are published by ratings agencies such as Standard and Poor's and Moody's.
Data requirements • Credit ratings for the debtor • Default data for the debtor • Loss given default • Exposure • Information about credit correlations
Methodology • CreditMetrics™ measures changes inportfolio value by predicting movements in a debtor's credit ratings. • After the values of the individual portfolio investments are determined, CreditMetrics™ can calculate the credit risk.
Average cumulative default rates (%), 1970-2003 (Source: Moody’s) 5
Recovery rates on corporate bonds as a percent of face value, 1982-2004. (Source: Moody’s). 6
CreditMetrics™ Software – CreditManager® • The software used by Credit Metrics is called CreditManager. • CreditManager® enables a financial institution to consolidate credit risk across its entire organization. • CreditManager® automatically maps each credit that the user loads into the system to its appropriate debtor and market data. • It computes correlations and changes in asset value over the risk horizon due to upgrades, downgrades and defaults. • In this way, it arrives at a final figure for portfolio credit risk. • The software uses two types of data : • Position • Market
Steps for calculating credit risk for a single-credit portfolio • Determine the probability of credit rating migration. • Calculate the current value of the bond's remaining cashflows for each possible credit rating. • Calculate the range of possible bond values for each rating. • Calculate the credit risk.
Steps for calculating credit risk for a two-credit portfolio • Examine credit migration. • Calculate the range of possible bond values for each rating using independent or correlated credit migration probabilities. • Calculate the credit risk.
Steps for calculating credit risk for a multiple-credit portfolio • Calculate the distribution of values using a Monte Carlo simulation. • Use the standard deviation for this distribution to calculate the credit risk for the portfolio. • Alternatively use percentile levels.
Single credit portfolios • The steps to calculate distributed values for single-credit portfolios are: • Determine the probability of change in credit ratings. • Calculate the value of remaining cash flows for each possible credit rating. • Calculate the range of possible credit values for each rating. • The first step is to examine the probability of the bond moving from an one credit rating to another say within of one year. • The movement from one credit rating to another is known as credit migration. • Credit rating agencies publish credit migration probabilities based on historic data.
Bond values for different ratings • Having examined the different probabilities for credit rating migration, the next step is to calculate the range of possible bond values for each rating. • That means calculating the value of Bond X for a credit rating of Aaa, Aa, A, Baa, Ba, B, Caa, Ca, C. • To do this, we first need to calculate the value of the bond's remaining cash flows for each possible rating.
Discounting the cashflows • We use discount rates to calculate the current value of the bond's remaining cashflows for each credit rating. • These discount rates are taken from the forward zero coupon curve for each rating. • The forward zero coupon curve ranges from the end of the risk horizon – one year from now – to maturity.
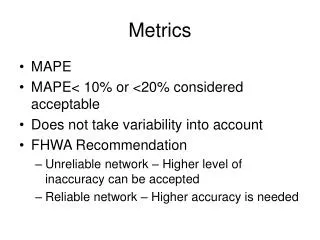
Given a distribution of final values for Bond X, we can then calculate two risk measurements for the portfolio: • Standard deviation • Percentile
Multiple-Credit Portfolios • Because of the exponential growth in complexity as the number of bonds increases, a simulation-based approach is used to calculate the distribution of values for large portfolios. • Using Monte Carlo simulation, CreditMetrics simulates the quality of each debtor, which produces an overall value for the portfolio. • This procedure is then repeated many times in order to get the distributed portfolio values. • After we have the distributed portfolio values, we can then use the standard deviation to calculate credit risk for the portfolio. • Alternatively, we can use percentile levels.
Portfolio Value Estimates at Risk Horizon • CreditMetrics requires three types of data to estimate portfolio value at risk horizon: • coupon rates and maturities for loans and bonds • drawn and undrawn amounts of a loan, including spreads or fees • market rates for market driven instruments, such as swaps and forwards
Correlations • One key issue in using Credit Metrics is handling correlations between bonds. • While determining credit losses, credit rating changes for different counterparties cannot be assumed to be independent. • How do we determine correlations? 17
Gausian Copula • A Gaussian Copula Model comes in useful here. • Gaussian Copula allows us to construct a joint probability distribution of rating changes. • The Copula correlation between the ratings transitions for two companies is typically set equal to the correlation between their equity returns using a factor model.
Implementing Credit Metrics • The first step is to estimate the rating class for a debt claim. • The rating may remain the same, improve or deteriorate, depending on the firm’s performance. • Ratings transition matrix gives us the probability of the credit migrating from one rating to another during one year. • Next, we construct the distribution of the value of the debt claim. • We compute the value we expect the claim to have for each rating in one year. 19
Based on the term structure of bond yields for each rating category, we can get today’s price of a zero coupon bond for a forward contract to mature in one year. • If the migration probabilities are independent, we can compute the probabilities for transition of each bond independently and multiply them to obtain the joint probability. • By computing the value of the portfolio for each possible outcome and the probability of each outcome, we can construct the distribution for the portfolio value. • We can then find out the VAR at a given level of confidence.
Transforming distributions with Gaussian copula Bivariate distribution with 0.3 correlation
The Credit migration of a BBB Bond Gupton, Finger, Bhatia, Credit Metrics technical document
Using the forward curve to compute bond values Consider an A Bond. The present value of cash flows can be calculated as follows: V = 6 + 6/1.0372 + 6/1.04322+ 6/1.04933+ 106/1.05324= 108.66 Consider a BBB Bond. The present value of cash flows can be calculated as follows: V = 6 + 6/1.041 + 6/1.04672 + 6/1.05253 + 106/1.05634 = 107.55
The credit migration of an A Bond Gupton, Finger, Bhatia, Credit Metrics technical document
Distribution of portfolio returns Gupton, Finger, Bhatia, Credit Metrics technical document