Download
1 / 20
210 likes | 470 Views
Metrics. "A science is as mature as its measurement tools." -- Louis Pasteur. Starter Questions. What can we measure? What value can those numbers have?. Why Measure?. accurate estimation how productive are we quality improvement what do we do well

E N D
Metrics "A science is as mature as its measurement tools." -- Louis Pasteur
Starter Questions • What can we measure? • What value can those numbers have?
Why Measure? • accurate estimation • how productive are we • quality improvement • what do we do well • what do we do poorly
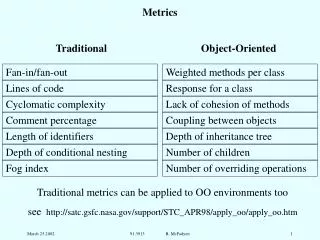
Types of Metrics • Product Metrics • direct measures - number of bugs, LOC • indirect measures - usability, maintainability • Project and Process Metrics • direct measures - costs, LOC per month • indirect measures - quality assurance, reliability
Code Metrics • Size • Lines of Code • Function Points • Efficiency • BigO • Complexity • Cyclomatic Complexity • Halstead's complexity metrics (next slide) • Maintainability
Halstead's Complexity Metrics n1 = the number of distinct operators n2 = the number of distinct operands N1 = the total number of operators N2 = the total number of operands Program length N = N1 + N2 Program vocabulary n = n1 + n2 Volume V = N * (LOG2 n) Difficulty D = (n1 / 2) * (N2 / n2) Effort E = D * V
McCall's Quality Factors Portability Reusability Interoperability Maintainability Flexibility Testability Product Revision Product Transition Product Operations Correctness Reliability Efficiency Integrity Usability
Operability Training Communicativeness Input/Output volume Input/Output gate Access Control Access Audit Storage efficiency Execution Efficiency Traceability Completeness Accuracy Error Tolerance Consistency Simplicity Conciseness Instrumentation Expandability Generality Self-Descriptiveness Modularity Machine Independence Software System Independence Communications Commonality Data Commonality Usability Integrity Efficiency Correctness Reliability Maintainability Testability Flexibility Reusability Portability Interoperability
ISO 9126 Quality Characteristics and Guidelines for Their Use Quality Factors • Functionality • Reliability • Usability • Efficiency • Maintainability • Portability
Design Metrics • Fan In • Fan Out • Morphology • based on number of nodes, depth, width
Module Design Metrics • Cohesion • how many functions does a module perform • coincidental • logical - eg does all output • temporal - eg all the startup work • procedural - executed in this order • communicational - module arrangement on work on what data • functional • Coupling • how is the module connected to other modules • global variable, parameters, stands alone
Object-Oriented Metrics • Weighted Methods per Class • not only how many methods per class are there, but also how complex are they • Depth of Inheritance Tree • Number of Children • how many child classes does a class have • Response for Class • number of local methods, plus number of methods they call • Lack of Cohesion Metric • number of non-intersecting (don't use the same variables) methods
Lack of Cohesion Example • Module A calls Module B • B accesses Variable X • C and D access Y • D calls E • This should be split into two classes. A C D B E Y X
Project Metrics • LOC or FP per month • Errors per LOC (aka Defect Density) • Defect Removal Efficiency • Time required to make changes • Test coverage • Required Skills
Obviously,Beware of Statistics Version 2 Version 1 Module# Defects LOC Defects/LOC Defects LOC Defects/LOC Relation 1 12 777 0.01544 3 55 0.05455 < 2 5 110 0.04545 6 110 0.05455 < 3 2 110 0.01818 3 110 0.02727 < 4 3 110 0.02727 4 110 0.03636 < 5 6 1000 0.00600 70 10000 0.00700 < Sum 28 2107 0.01329 86 10385 0.00828 > http://irb.cs.tu-berlin.de/~zuse/sme.html
Basic Questions • What are the basic metrics that managers need to track? • How do we gather all these numbers? • When do we process all these numbers?
SEI CMM Level 2 (repeatable) • Software Requirements Management • status of allocated requirements • number of changes to requirements • Software Project Planning • completion of milestones compared to the plan • work completed, funds expended, … compared to plan • Software Project Tracking and Oversight • resources expended to conduct oversight
SEI CMM Level 3 (defined) • Training Program • number of training waivers approved • actual attendance vs projected attendance • results on post-training tests • Software Product Engineering • numbers, types, and severity of defects by stage • effort to analyze proposed changes • number of changes by category
Summary To do something well, we must understand what we are doing. To understand something, we must be able to measure it. We can measure what we are building and we can measure our building process.
Next Topics… • Managing the testing process • Configuration Management • Exam #2