Download

1 / 45
460 likes | 809 Views
Metrics. Original prepared by: Sudipto Ghosh Revised: Aditya Mathur. Latest update: October 28, 3003. Learning objectives. Software metrics. Metrics for various phases. Why are metrics needed. How to collect metrics. How to use metrics. Questions. How big is the program? Huge!!.

E N D
Metrics Original prepared by: Sudipto Ghosh Revised: Aditya Mathur Latest update: October 28, 3003
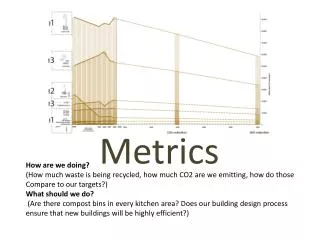
Learning objectives • Software metrics • Metrics for various phases • Why are metrics needed • How to collect metrics • How to use metrics Metrics
Questions • How big is the program? • Huge!! • How close are you to finishing? • We are almost there!! • Can you, as a manager, make any useful decisions from such subjective information? • Need information like, cost, effort, size of project. Metrics
Metrics • Quantifiable measures that could be used to measure characteristics of a software system or the software development process • Required in all phases • Required for effective management • Managers need quantifiable information, and not subjective information • Subjective information goes against the fundamental goal of engineering. Metrics
Kinds of software metrics • Product metrics • quantify characteristics of the product being developed • size, reliability • Process metrics • quantify characteristics of the process being used to develop the software • efficiency of fault detection Metrics
CMM • Level 4: Managed level • Process measurement performed • Quality and productivity goals set • Continually measured and corrective actions taken • Statistical quality controls in place • Level 5: Optimizing level • Statistical quality and process control in place • Positive feedback loop used for improvement in productivity and quality Metrics
Issues [1] • Cost of collecting metrics • Automation is less costly than manual method • CASE tool may not be free • Development cost of the tool • Extra execution time for collecting metrics • Interpretation of metrics consumes resources • Validity of metrics • Does the metric really measure what it should? • What exactly should be measured? Metrics
Issues [2] • Selection of metrics for measurement • Hundreds available and with some cost • Basic metrics • Size (like LOC) • Cost (in $$$) • Duration (months) • Effort (person-months) • Quality (number of faults detected) Metrics
Selection of metrics • Identify problems from the basic metrics • high fault rates during coding phase • Introduce strategy to correct the problems • To monitor success, collect more detailed metrics • fault rates of individual programmers Metrics
Utility of metrics • LOC • size of product • take at regular intervals and find out how fast the project is growing • What if # defects per 1000 LOC is high? • Then even if the LOC is high, most of the code has to be thrown away. Metrics
Applicability of metrics • Throughout the software process, like • effort in person-months • staff turnover • cost • Specific to a phase • LOC • # defects detected per hour of reviewing specifications Metrics
Metrics: planning • When can we plan the entire software project? • At the very beginning? • After a rapid prototype is made? • After the requirements phase? • After the specifications are ready? • Sometimes there is a need to do it early. Metrics
Metrics: planning • graph of cost estimate 4 3 Relative range of cost estimate 2 Requirements Specifications Design Implementation Integration Phase during which cost estimation is made Metrics
Planning: Cost estimation • Client wants to know: • How much will I have to pay? • Problem with • underestimation (possible loss by the developer) • overestimation (client may offer bid to someone else) • Cost • internal (salaries of personnel, overheads) • external (usually cost + profit) Metrics
Cost estimation • Other factors: • desperate for work - charge less • client may think low cost => low quality, so raise the amount • Too many variables • Human factors • Quality of programmers, experience • What if someone leaves midway • Size of product Metrics
Planning: Duration estimation • Problem with underestimation • unable to keep to schedule, leading to • loss of credibility • possible penalty clauses • Problem with overestimation • the client may go to other developers • Difficulty because of similar reasons as for cost estimation Metrics
Metrics: planning - size of product • Units for measurement • LOC = lines of code • KDSI = thousand delivered source instructions • Problems • creation of code is only a part of the total effort • effect of using different languages on LOC • how should one count LOC? • executable lines of code? • data definitions • comments? What are the pros and cons? Metrics
Problems with lines of code • Problems • More on how to count • Job control language statements? • What if lines are changed or deleted? • What if code is reused? • Not all code is delivered to clients • code may be for tool support • What if you are using a code generator? • Early on, you can only estimate the lines of code. So, the cost estimation is based on another estimated quantity!!! Metrics
Estimating size of product • FFP metric for cost estimation of medium-scale products • Files, flows and processes (FFP) • File: collection of logically or physically related records that are permanently resident • Flow: a data interface between the product and the environment • Process: functionally defined logical or arithmetic manipulation of data S = #Files + #Flows + #Process, Cost = b x S b: Organization dependent constant. Metrics
Techniques of cost estimation • Take into account the following: • Skill levels of the programmers • Complexity of the project • Size of the project • Familiarity of the development team • Availability of CASE tools • Deadline effect Metrics
Techniques of cost estimation • Expert judgement by analogy • Bottom up approach • Algorithmic cost estimation models • Based on mathematical theories • resource consumption during s/w development obeys a specific distribution • Based on statistics • large number of projects are studied • Hybrid models • mathematical models, statistics and expert judgement Metrics
COnstructive COst Model: COCOMO • Series of three models • Basic - macroestimation model • Intermediate COCOMO • Detailed - microestimation model • Estimates total effort in terms of person-months • Cost of development, management, support tasks included • Secretarial staff not included Metrics
a b System Organic Semi-detached Embedded 3.2 3.0 2.8 1.05 1.12 1.20 Intermediate COCOMO • Obtain an initial estimate (nominal estimate) of the development effort from the estimate of KDSI • Nominal effort = a X (KDSI)b person-months Metrics
Kind of systems • Organic • Organization has considerable experience in that area • Requirements are less stringent • Small teams • Simple business systems, data processing systems • Semi-detached • New operating system • Database management system • Complex inventory management system Metrics
Kind of systems • Embedded • Ambitious, novel projects • Organization has little experience • Stringent requirements for interfacing, reliability • Tight constraints from the environment • Embedded avionics systems, real-time command systems Metrics
Intermediate COCOMO (contd.) • Determine a set of 15 multiplying factors from different attributes (cost driver attributes) of the project http://sunset.usc.edu/research/COCOMOII/ • Adjust the effort estimate by multiplying the initial estimate with all the multiplying factors • Also have phase-wise distribution Metrics
Determining the rating • Module complexity multiplier • Very low: control operations consist of a sequence of constructs of structured programming • Low: Nested operators • Nominal: Inter-module control and decision tables • High: Highly nested operators, compound predicates, stacks and queues • Very high: Reentrant and recursive coding, fixed priority handling Metrics
Four major modules • data entry: 0.6 KDSI • data update: 0.6 KDSI • query: 0.8 KDSI • report generator: 1.0 KDSI • Total: 3.0 KDSI COCOMO example • System for office automation • Category: organic • Initial effort: 3.2 * 31.05 = 10.14 PM • (PM = person-months) Metrics
COCOMO example (contd) • From the requirements the ratings were assessed: • Complexity High 1.15 • Storage High 1.06 • Experience Low 1.13 • Programmer Capability Low 1.17 • Other ratings are nominal (=1.0) • EAF = 1.15 * 1.06 * 1.13 * 1.17 = 1.61 • Adjusted effort = 1.61 * 10.14 = 16.3 PM Metrics
Metrics: requirements phase • Number of requirements that change during the rremainder of the software development process • if a large number changed during specification, design, …, something is wrong in the requirements phase • Metrics for rapid prototyping • Are defect rates, mean-time-to-failure useful? • Knowing how often requirements change? • Knowing number of times features are tried? Metrics
Metrics: specification phase • Size of specifications document • may predict effort required for subsequent products • What can be counted? • Number of items in the data dictionary • number of files • number of data items • number of processes • Tentative information • a process in a DFD may be broken down later into different modules • a number of processes may constitute one module Metrics
Metrics: specification phase • Cost • Duration • Effort • Quality • number of faults found during inspection • rate at which faults are found (efficiency of inspection) Metrics
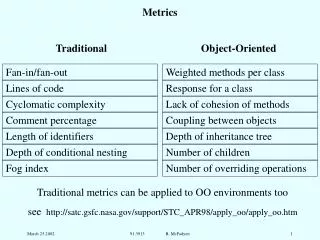
Metrics: design phase • Number of modules (measure of size of target product) • Fault statistics • Module cohesion • Module coupling • Cyclomatic complexity • Fan-in, fan-out Metrics
1-2+2=1 4-4+2=2 3-3+2=2 Straight line code if-then-else while-do Mccabe’s Cyclomatic Complexity Number of independent test paths=edges-nodes+2 Metrics
McCabe’e Cyclomatic complexity • Number of binary decisions + 1 • The number of branches in a module • Lower the value of this number, the better • Only control complexity, no data complexity • For OO, cyclomatic complexity is usually low because methods are mostly small • also, data component is important for OO, but ignored in cyclomatic complexity Metrics
Architecture design as a directed graph • Fan-in of a module: • Fan-out of a module: • number of flows out of the module plus the number of data structures updated by the module • Measure of complexity: • length X (fan-in X fan-out)2 Metrics
Metrics: implementation phase • Intuition: more complex modules are more likely to contain faults • Redesigning complex modules may be cheaper than debugging complex faulty modules • Measures of complexity: • LOC • assume constant probability of fault per LOC • empirical evidence: number of faults related to the size of the product Metrics
Metrics: implementation phase • McCabe’s cyclomatic complexity • Essentially the number of branches in a module • Number of tests needed for branch coverage of a module • Easily computed • In some cases, good for predicting faults • Validity questioned • Theoretical grounds • Experimentally Metrics
Metrics: implementation phase • Halstead’s software metrics • Number of distinct operators in the module (+. -. If, goto) • Number of distinct operands • Total number of operators • Total number of operands Metrics
Metrics: implementation phase • High correlation shown between LOC and other complexity metrics • Complexity metrics provide little improvement over LOC • Problem with Halstead metrics for modern languages • Constructor: is it an operator? Operand? Metrics
Metrics: implementation and integration phase • Total number of test cases • Number of tests resulting in failure • Fault statistics • Total number of faults • Types of faults • misunderstanding the design • lack of initialization • inconsistent use of variables • Statistical testing: • zero-failure technique Metrics
Zero failure technique • The longer a product is tested without a single failure being observed, the greater the likelihood that the product is free of faults. • Assume that the chance of a failure decreases exponentially as testing proceeds. • Figure out the number of test hours required without a single failure occurring. Metrics
Metrics: inspections • Purpose: to measure the effectiveness of inspections • may reflect deficiencies of the development team, quality of code • Measure fault density • Faults per page - specs and design inspection • Faults per KLOC - code inspection • Fault detection rate - #faults / hour • Fault detection efficiency - #faults/person-hour Metrics
Metrics: maintenance phase • Metrics related to the activities performed. What are they? • Specific metrics: • total number of faults reported • classifications by severity, fault type • status of fault reports (reported/fixed) Metrics
References • Textbook • Roger Pressman: Chapters 4, 19 • Other books • P. Jalote - An Integrated Approach to Software Engineering (Look at metrics under Index) • Internet reference www.cs.waikato.ac.nz/~bernhard/314/schachSlides/ schach5-chap09-14%5B1%5D.ppt Metrics