Download
1 / 36
360 likes | 493 Views
Status and Plans for the US CLIVAR MJOWG Forecast Metric Activity at NCEP Jon Gottschalck, Qin Zhang US CLIVAR MJOWG Forecast Metrics Team NOAA / Climate Prediction Center “Workshop on Multi-scale Predictions of the Asian and African Summer Monsoon” Trieste, Italy August 11-15, 2008.

E N D
Status and Plans for the US CLIVAR MJOWG Forecast Metric Activity at NCEP Jon Gottschalck, Qin Zhang US CLIVAR MJOWG Forecast Metrics Team NOAA / Climate Prediction Center “Workshop on Multi-scale Predictions of the Asian and African Summer Monsoon”Trieste, Italy August 11-15, 2008
Outline and Goals • Background, Motivation • Status and Examples • Web page overview • Current Issues • Plans • Applications • 1. Describe MJOFM activity, entice further participation • 2. Outline the illustration of this information (when completed) • 3. Introduce an operational assessment with collaborative opportunities (related to ENSO, MJO / ISO)
Background and Motivation • US CLIVAR MJOWG designated a team focused on MJO realtime operational forecasting issues • Recently some operational centers have applied WH2004 MJO filtering to model output • Varying datasets used with center specific methodologies
Background and Motivation UKMET NCEP CMC ABOM
Background and Motivation • US CLIVAR MJOWG outlined a strategy for uniform application and display of WH2004 • Provide framework for better coordination of these evaluations • Focus additional visibility and expertise to the operational MJO forecasting issue • Means to quantify MJO forecast skill within and across Centers
CLIVAR Activity Specifics • Housed at NCEP – Climate Prediction Center (CPC) • Data received: Raw data and not RMM1 and RMM2 Previous days analysis as initial condition • All ensemble forecast members • Model forecast anomalies based on NCEP Reanalysis (1979-2001) • Project model anomalies on observed EOFs
CLIVAR Activity Specifics • NCEP ftp site established and supported 24 hours / 7 days • CPC receiving data in realtime • Current participating operational centers: • NCEP: National Centers for Environmental Prediction • ECMWF: European Centre for Medium Range Weather Forecasting • UKMO: United Kingdom Meteorology Office • CMC: Canadian Meteorology Centre • ABOM: Australian Bureau of Meteorology • CPTEC: Brazilian Centre for Time and Climate Studies • JMA: Japan Meteorology Agency
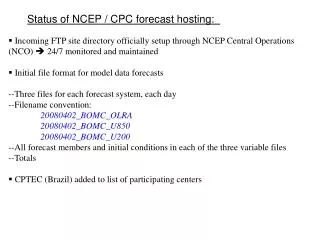
CLIVAR Activity Specifics W: forecast sent only once per week See web page for key to Product IDs http://www.cpc.ncep.noaa.gov/products/precip/CWlink/MJO/clivar_wh.shtml
Examples – Display Format Observational RMM1 / RMM2 values for the past 40 days 15-day model forecasts --Green line: Ensemble mean week 1 (thick), week 2 (thin) --Ensemble members light gray shading: 90% of forecasts dark gray shading: 50% of forecasts
Examples – Model Comparison NCPE UKME ECMF CANM
Issues – Model Bias Day 1 jump is a combination of: 1. Both real amplitude increase (future observations show this) 2. Model bias (using NCEP Reanalysis climatology) ECMF
Issues – Lead Dependent Model Climatology? ECMF ECMM Anomalies based on a bias corrected, model climatology Anomalies based on using NCEP Reanalysis observation climatology Substantial difference so we need to spend some time to verify and understand
Issues – Initial Operational Lessons Learned • Generally accurate depiction for strong MJO development • Eastern Maritime Continent, western Pacific • Second MJO cycle of 2007-2008 event • Similar geographical location
Issues – Initial Operational Lessons Learned • Accurate forecasts often from Pacific into the Indian Ocean • Wind signal contributes substantially to the MJO index • Most models correctly forecast this evolution for the 2007-2008 MJO event UKME CANM
Issues – Initial Operational Lessons Learned • Problems with MJO propagation, strength, and coherency in transition region • Indian Ocean/Maritime Continent (model convection issues)
Preliminary Website – Main Page http://www.cpc.ncep.noaa.gov/products/precip/CWlink/MJO/clivar_wh.shtml • Scroll-over Heading Labels • Links to Model Specific Information
Preliminary Website – Forecast Phase Plots Key for Model Heading Labels
Planned Verification – Phase Plots • Assess overall amplitude and propagation daily
Planned Verification • Currently insufficient forecast data length for verification
Planned Verification – Comments --Final verification of RMM’s will be against a “multi-model analysis” (MMA) and satellite OLR --Each Centre is welcome to verify forecasts with their Centre analysis --Comprehensive verification is planned when data record is of sufficient length Stratify by MJO phase, amplitude, etc. Composite structure of each operational model MJO
Multi-Model Ensemble • Multi-model ensemble (MME) is a high priority • Two MME methodologies: 1. Equal weights for each model at all leads and time of the year 2. Objectively partition weights based on historical skill Focuses on utilizing the independent skill from each method • Weights are a function of model, lead and seasonal cycle • Retrospective forecasts needed • Build upon similar CPC effort that uses this approach for consolidation of statistical and dynamical (CFS) MJO forecast methods
Multi-Model Ensemble • Weights are a function of forecast method, time of year, and lead Constructed Analogue Autoregression Model Climate Forecast System Greatest contribution of all methods Largest during Jan-Mar, May-Jul Little contribution to the consolidated forecast at early leads Substantial contribution during summer CFS contributes to the consolidated forecast during the late summer-early fall only
Multi-Model Ensemble • Need commitment from operational Centers Understanding the importance of hindcasts for MME US CLIVAR MJOWG will need to make the case for why this would work and help research and operational interests • Computational and human resources the major roadblock
Applications – ABOM / NCEP MJO updates • Purpose: • Review of weekly changes in the MJO • Anticipated evolution of the MJO during the next 1-2 weeks • WH phase plots from operational centers used as guidance
Applications – NCEP Global Tropics Hazard Assessment http://www.cpc.ncep.noaa.gov/products/precip/CWlink/ghazards/ghaz.shtml
Applications – NCEP Global Tropics Hazard Assessment Outlook: • Extensive, persistent enhanced / suppressed rainfall • Regions favorable/unfavorable for tropical cyclogenesis • Week 1 and 2 Purpose: • Advance notice of potential hazards related to climate, weather and hydrological events (US sectors: finance, energy, agriculture, water resources) Forecast Physical Basis: • ENSO, MJO, ISO, other coherent subseasonal tropical variability • Interactions with the extratropical circulation • Numerical weather forecast guidance • Boundary layer forcing (i.e. SST, soil moisture, etc.) • Statistical tropical cyclone development tools
Applications – NCEP Global Tropics Hazard Assessment Mar 2005 - Jul 2008 Mar 2005 - Jul 2008 Mar 2005 - Nov 2006 Mar 2005 - Nov 2006 --Positive values indicate the percent improvement over random forecasts --Zero (blue line) indicates no skill --Negative values indicate the percent degradation over random forecasts
Applications – NCEP Global Tropics Hazard Assessment (b) Week 2 (Mar 2005 - Feb 2007) (a) Week 1 (Mar 2005 - Jul 2008) • Hit Rate: correct “yes” and “no” forecasts, [(a+d)/n] • Basic Hit Rate: correct “yes” forecasts, [a / (a+b)] • Probability of Detection (POD):[a / (a+c)] • False Alarm Rate (FAR): [b / (a+b)] • The total number of forecasts, n=(a+b+c+d)
Closing Remarks -- Status • Initial infrastructure, procedure, format established at CPC for forecasting metric activity of the MJOWG • Participation from 7 operational centers • Initial application of CLIVAR recipe applied to most model data streams • Version 1 realtime webpage developed
Closing Remarks – Moving Forward MJOWG / CPC Operational Centers Operational Centers Research MJOWG / CPC • Substantial issues need to addressed (bias, further inspection of data, reasons for large differences, etc.) • Feedback from MJOWG/CPC to operational centers • 1. Plan to organize and document above issues as a function of PID • 2. Document operational forecast experience as a function of PID
Closing Comments – Moving Forward • Seek participation from additional operational centers • Website will be vetted through the MJOWG and operational centers before officially publicized to the larger community • Please don’t forget about the operational forecasting community when doing your MJO and monsoon research work
Questions / Comments / Suggestions? Jon.Gottschalck@noaa.gov
Examples – WH2004 vs CLIVAR Non-CLIVAR Recipe (Current CPC Realtime) CLIVAR Recipe Slight shift to the upper-left in phase space Plots similar to first order
Examples – WH2004 vs CLIVAR Non-CLIVAR Recipe (Current CPC Realtime) CLIVAR Recipe Slight shift to the upper-left in phase space Plots similar to first order