Download
1 / 1
10 likes | 72 Views
Predicting Social Support Group Membership ??? ? ??? University of Nebraska-Lincoln. Results.

E N D
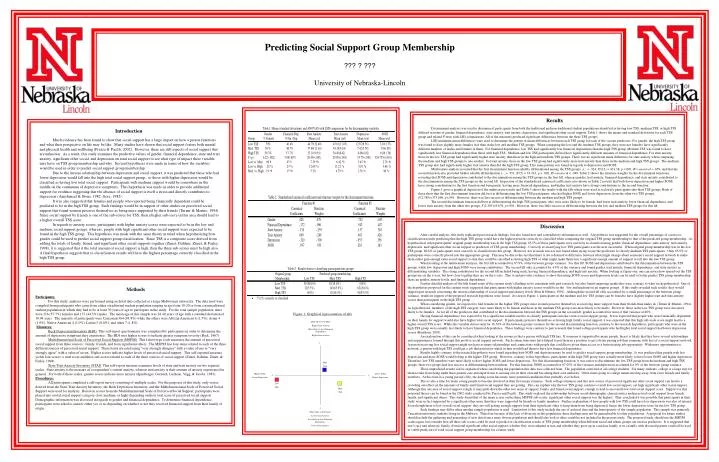
Predicting Social Support Group Membership ??? ? ??? University of Nebraska-Lincoln Results Discriminant analysis was used to determine if participants from both the traditional and non-traditional student populations identified as having low TSS, medium TSS, or high TSS differed in terms of gender, financial dependence, state anxiety, trait anxiety, depression, and significant other social support. Table 1 shows the means and standard deviations for each TSS group and related F-tests with LSD comparisons. All of the measures produced significant differences between the three TSS groups. LSD minimum mean differences were used to determine the pattern of mean differences between each TSS group for each of the various predictors. For gender, the high TSS group was found to have slightly more females in it than in the low and medium TSS groups. When comparing the low and the medium TSS groups, they were not found to have significantly different numbers of males and females in them. For financial dependence, low TSS had significantly less financial dependence than the high TSS group. Medium TSS was found to have significantly less financial dependence than those with high TSS. Medium and low TSS participants did not have significantly different amounts of financial dependence. For state anxiety, those in the low TSS group had significantly higher state anxiety than those in the high and medium TSS groups. There was no significant mean difference for state anxiety when comparing the medium and high TSS groups to one another. For trait anxiety, those in the low TSS group had significantly more trait anxiety than those in the medium and high TSS groups. The medium TSS group also had significantly higher trait anxiety than did the high TSS group. This same pattern was found in regards to depression and SOSS. Multivariate analysis revealed that the first discriminant function reliably differentiated among the TSS groups, λ = .324, X²(12) = 431.38, p <.001, R²-canonical = .659, and that the second function also provided further reliable differentiation λ = .951, X²(5) = 19.141, p = .002, R²-canonical = .049. Table 2 shows the structure weights for the discriminant functions, revealing that SOSS and depression contributed to the discrimination among the TSS groups in the first ldf, whereas gender, trait anxiety, financial dependence, and state anxiety contributed to the discrimination among the TSS groups in the second ldf. Inspection of the standardized canonical coefficients also shown in Table 2 reveals that both lower depression and higher SOSS have strong contributions to the first function and being male, having more financial dependence, and higher trait anxiety have strong contributions to the second function. Figure 1 gives a graphical depiction of the multivariate results and Table 3 shows the results with the ldfs which were used to reclassify participants into their TSS groups. Both of these show that the first discriminant function did best at differentiating the low TSS participants, who had higher SOSS and lower depression, from the other two TSS groups, F(2,385)=373.069, p<.001. However, there was less success at differentiating between the medium and high TSS groups. The second discriminant function did best at differentiating the high TSS participants, who were more likely to be female, had lower trait anxiety, lower financial dependence, and lower state anxiety from the other two groups, F(2,385)=9.878, p<.001 . However, there was little success at differentiating between the low and medium TSS groups for this ldf. Introduction Much evidence has been found to show that social support has a large impact on how a person functions and what their perspective on life may be like. Many studies have shown that social support fosters both mental and physical health and wellbeing (Prezza & Pacilli, 2002). However, there are still aspects of social support that are unknown. As a result, this study examines the predictive values of gender, financial dependence, state and trait anxiety, significant other social, and depression on total social support to see what type of impact these variable may have on TSS group membership and why. Several hypotheses were made in terms of how the variables would be used in order to predict social support group membership. Due to the inverse relationship between depression and social support, it was predicted that those who had lower depression would fall into the high total social support group, so those with higher depression would be classified as having low total social support. Participants with medium support would be somewhere in the middle on the continuum of depressive symptoms. This hypothesis was made in order to provide additional support for evidence suggesting that the absence of social support is itself a stress and directly contributes to depression (Aneshensel & Stone, 1982; Gore, 1982). It was also suggested that females and people who reported being financially dependent could be predicted to be in the high TSS group. Such findings would be in support of other studies on perceived social support that found women perceive themselves as being more supported by their friends (Turner & Marino, 1994). Since social support by friends is one of the sub-scores for TSS, then a higher sub-score in this area should lead to a higher overall TSS score. In regards to anxiety scores, participants with higher anxiety scores were expected to be in the low and medium social support groups, whereas, people with high significant other social support were expected to be found in the high TSS group. This hypothesis was made with the same theory in mind when hypothesizing how gender could be used to predict social support group classification. Since TSS is a composite score derived from adding the totals of family, friend, and significant other social supports together (Zimet, Dahlem, Zimet, & Farley, 1998), it is suggested that if the total amount of social support is high, then the three sub-scores must be high also. A final hypothesis suggests that re-classification results will have the highest percentage correctly classified in the high TSS group. Discussion After careful analysis, this study replicated past research findings, but also found new and contradictory information as well. A hypothesis was suggested for the overall percentage of correct re-classification results predicting that the high TSS group would have the highest percent correctly re-classified when comparing the original TSS group membership to that of the predicted group membership. As hypothesized, when participants’ original group membership was in the high TSS group, 83.5% of these participants were correctly re-classified using gender, financial dependence, state anxiety, trait anxiety, depression, and significant other social support as predictors of TSS group membership. Correctly re-classifying low TSS participants was the next successful. When original group membership was in the low TSS group, 80.6% of participants were correctly re-classified into this group. However, not as much success was found when trying to use the predictors to classify medium TSS participants. Only 65.9% of participants were correctly placed into the appropriate group. This may be due to the fact that there is not a distinctive difference between what might change about someone’s social support network to make them either gain enough extra social support so that they could be classified as having high TSS or what might make them lose a significant enough amount of support to fall into the low TSS group. When looking at the multivariate analyses, the first ldf accounted for 65.9% of the between groups variance. For this ldf, SOSS and depression contributed to the discrimination between the TSS groups, while low depression and high SOSS were strong contributors. The second ldf only accounted for 4.9% of the variance and found gender, trait anxiety, financial dependence, and state anxiety as differentiating variables. The strong contributors for the second ldf included being male, having financial dependence, and high trait anxiety. When looking at figure one, one can notice how spread out the TSS groups are on the x-axis, but how close together they are on the y-axis. This visual provides evidence to show that using SOSS scores and depression levels can be used to better predict TSS group membership than can gender, anxiety levels, and financial dependence. Further detailed analysis of the ldfs found some of the current study’s findings to be consistent with past research, but also found surprising results that were contrary to what we hypothesized. One of the hypotheses proposed for the current study suggested that participants with higher anxiety scores would be in the low and medium social support groups. If this study revealed such results, they would support past research concerning the inverse relationship of social support and anxiety levels (Hart & Hittner, 1991). Although the second ldf only accounted for a small percentage of the between group variance, results in support of the proposed research hypothesis were found. As seen in Figure 1, participants in the medium and low TSS groups can be found to have slightly higher trait and state anxiety scores than participants in the high TSS group. When considering gender, we expected to find females in the higher TSS groups since women perceive themselves as receiving more support from their friends than males do (Turner & Marino, 1994). As hypothesized, members of the high TSS category were more likely to be female and those in the medium TSS group were more likely to be males. However, those in the low TSS group were also more likely to be females. As for all of the predictors that contributed to the discrimination between the TSS groups on the second ldf, gender accounted for most of that variance at 40%. Having financial dependence was expected to be a significant variable used to re-classify participants into the correct social support group. It was expected that people who were financially dependent on their family for support would also have higher total social support. If participants perceive themselves as having high family social support, it was expected that this high sub-scale score might lead to a higher overall TSS score. While this variable did account for 16.56% of the between groups variance for the second discriminating function, contrary to the research hypothesis, participants who were in the high TSS group were actually less likely to have financial dependence. These findings were contrary to past research that found college participants who had higher total social support had lower depression scores (Hanthorn, 2005). An explanation of this can be considered when looking at the resources that a person with high TSS has. If someone is supported by many people, then it is likely that they have several relationships and acquaintances formed through this positive social support network. Such connections may have helped to put them in a position to get a better paying job than someone with less of a social support network. A person receiving less social support might not have as many relationships and connections with people that could have given them access to a better paying job opportunity. With more opportunities to network, a person with high TSS could get a job that paid more which in turn would lead them to have less financial dependence. Results highly contrary to the research hypothesis were found regarding how SOSS and depression may be used to predict social support group membership. Is was predicted that people with less depression and more SOSS would belong to the higher TSS group. However, contrary to this hypothesis, participants in the high TSS group were actually more likely to have lower SOSS and higher depression. Therefore, low TSS members were more likely to have higher SOSS and lower depression. For this discriminating function, it was easier to discriminate the low TSS group from the medium and high TSS groups; these two groups had less success at differentiating between them. For this function, SOSS accounted for 87.05% of the variance and depression accounted for 9% of the between group variance. These unpredicted results can be explained when considering the population this data was collected from. The population consisted of all college students. For many students, college is a large step for them to take from being under their parents care and supervision to moving out on their own and becoming their own authority. Often times going to college means moving away from close friends and family members. At this time in a young person’s life, the dating scene has many more potential candidates than probably ever before. This is also a time for many young people to become involved in their first major romance. Such college romances and this new source of perceived significant other social support can lead to a crowding out effect on the amounts of family and friend social support they are getting. This can explain why the low TSS group can have overall low social support, yet high significant other social support. Although this one area of social support is high, it may push down the other two areas of support, family and friend social support, enough to lead to an overall low total social support score. Support for this proposed theory can be found in the 2002 study conducted by Prezza and Pacilli. This study explored the relationship between social-demographic characteristics and perceived social support from friends, family, and significant others. This study found that of the mean scores on the three MSPSS sub-scales, significant other social support was the highest. They concluded it was possible that participants in their study were in fact supported by a significant other more than they were supported by friends or family members. Further explanation of how people with low TSS could have low depression was also of interest. Even though there is low overall social support, they are still getting enough support from their significant other to keep them from being depressed, hence the lower depression score for the low TSS group. Such findings may differ when another sample population is used. Limitations to this study include the use of archival data and the homogeneity of the sample population. This sample was primarily Caucasian university students living in the Midwest. Therefore because of the lack of diversity in this population, these findings may not be generalizable to other populations. A proposal for future studies should include the gathering and generating of new data from a more diverse population and should also look at other variables not included in the present study. The proposed study should use the MSPSS scales again, but consider how all three sub-scores could be used to predict re-classification results of TSS group membership when different racial and ethnic groups are used as predictors. It is suggested that one’s race and ethnicity, family, friend and significant other social support, whether they were adopted or not, and whether they grew up in a nuclear family or in a family with divorced parents could all be used as viable predictors of total social support group membership for a future study. Methods Participants: For this study, analyses were performed using archival data collected at a large Midwestern university. The data used were compiled from participants who came from either a traditional student population ranging in age from 18-20 or from a nontraditional student population in which they had to be at least 30 years of age to participate in the study. For the total sample population, there were 216 (55.7%) females and 172 (44.3%) males. The mean age of this sample was 28.40 years of age with a standard deviation of 10.94 years. The majority of participants were Caucasian 364 (93.8%) while the others were African American 6 (1.5%), Asian 4 (1.0%), Native American 4 (1.0%), Latino 3 (0.8%), and other 7 (1.8%). Measures: Beck Depression Inventory (BDI) This self-report questionnaire was completed by participants in order to determine the amount of depressive symptoms they experience. The BDI uses higher scores to indicate greater symptom severity (Beck, 1967). Multidimensional Scale of Perceived Social Support (MSPSS) This Likert-type scale measures the amount of perceived social support from three sources: family, friends, and from significant others. The MSPSS has four items related to each of the three different sources of perceived social support. These items are rated using “very strongly disagree” with a value of one to “very strongly agree” with a value of seven. Higher scores indicate higher levels of perceived social support. This self-reported measure yields four scores: a total score and three sub-scores related to each of the three sources of social support (Zimet, Dahlem, Zimet, & Farley, 1998). State-Trait Anxiety Inventory (STAI) This self-report measure examines levels of state and trait anxiety on two separate scales. State anxiety is the measure of a respondent’s current anxiety, whereas trait anxiety is their amount of anxiety experienced in general. For both of these scales, greater scores indicate more anxiety (Spielberger, Gorsuch, Lushene, Vagg, & Jacobs, 1983). Procedures: All participants completed a self-report survey consisting of multiple scales. For the purposes of this study, only scores derived from the State-Trait Anxiety Inventory, the Beck Depression Inventory, and the Multidimensional Scale of Perceived Social Support were used for analysis. Based on scores from the Multidimensional Scale of Perceived Social Support, participants were placed into a total social support category (low, medium, or high) depending on their total score of perceived social support. Demographic information was also used in regards to gender and financial dependence. To determine financial dependence, participants were asked to answer either yes or no depending on whether or not they received financial support from their family of origin. Figure 1. Graphical representation of ldfs