Download
1 / 36
440 likes | 762 Views
Some applications of solid-state NMR spectroscopy. Dieter Freude, Institut für Experimentelle Physik I der Universität Leipzig Skiseminar in the Dortmunder Hütte in Kühtai, 31 March 2008, 7:30 8:30 p.m. The 2 nd day of the Skiseminar. The faces.

E N D
Some applications of solid-state NMR spectroscopy • Dieter Freude, Institut für Experimentelle Physik I der Universität Leipzig Skiseminar in the Dortmunder Hütte in Kühtai, 31 March 2008, 7:308:30 p.m.
What you should keep in mind concerning the previous lecture
Larmor frequency For the magnetic field of 11.744 Tesla we obtain for nL about 500 MHz for 1H, 126 MHz for 13C 130 MHz for 27Al 202 MHz for 31P 77 MHz for 2H
shielded magnetic field B0(1-s) external magnetic field B0 OH- H+ electron shell The shielding or deshielding sof the external magnetic field B0gives rise to the chemical shift We fragment hypothetically a water molecule into hydrogen cation plus hydroxyl anion. Now the 1H in the cation has no electron shell, but the 1H in the hydroxyl anion is shielded (against the external magnetic field) by the electron shell. Two signals with a distance of about 35 ppm appear in the (hypothetical) 1H NMR spectrum.
NMR time scale and NMR shift scale The figure shows at left thefree induction decay (FID)as a function of time and at right the Fourier transformed 1H NMR spectrum of alcohol in fully deuterated water. An NMR spectrum is not shown as a function of the frequency n = (g / 2p) B0(1-s), but rather on a ppm-scale of the chemical shift d= 106(nref-n) /nL, where the reference sample is tetramethylsilane (TMS) for 1H, 2H, 13C, and 29Si NMR.
Hahn echo p/2 pulseFID, p pulse around the dephasing around the rephasing echo y-axisx-magnetizationx-axisx-magnetization a(r,t) = Dw(r)·t a(r,t) = -a(r,t) + Dw(r)·(t -t)
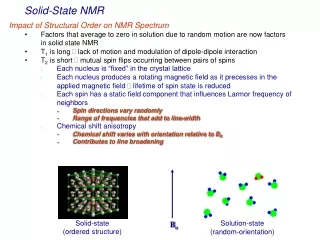
The difference between solid-state and liquid NMR,the lineshape of water solid water (ice) Dn / kHz -10 -40 -30 -20 0 10 20 30 40 liquid water Dn / Hz -0.1 -0.4 -0.3 -0.2 0 0.1 0.2 0.3 0.4
High-resolution solid-state MAS NMR Fast rotation (1-60 kHz) of the sample about an axis oriented at 54.7° (magic-angle) with respect to the static magnetic field removes all broadening effects with an angular dependency of rotor with sample in the rf coil zr B0 rot θ That means chemical shift anisotropy,dipolar interactions,first-order quadrupole interactions, and inhomogeneities of the magnetic susceptibility. It results an enhancement in spectral resolution by line narrowing also for soft matter studies. gradient coils forMAS PFG NMR
Laser supported high-temperature MAS NMRfor time-resolved in situ studies of reaction stepsin heterogeneous catalysis: the NMR batch reactor
Solid-state NMR on porous materials • 1H MAS NMR spectra including TRAPDOR • 29Si MAS NMR • 27Al 3QMAS NMR • 27Al MAS NMR • 1H MAS NMR in the range from 160 K to 790 K 1H MAS NMR on molecules adsorbed in porous materials • Hydrogen exchange in bezene loaded H-zeolites • In situ monitoring of catalytic conversion of molecules in zeolites by 1H, 2H and 13C MAS NMR • MAS PFG NMR studies of the self-diffusion of acetone-alkane mixtures in nanoporous silica gel
1H MAS NMR with 27Al dephasing p/2 t2 t1 t1 time 0 echo FID p 1H MAS NMR spectra, TRAPDOR
1H MAS NMR spectra, TRAPDOR Without and with dipolar dephasing by 27Al high power irradiation and difference spectra are shown from the top to the bottom. The spectra show signals of SiOH groups at framework defects, SiOHAl bridging hydroxyl groups, AlOH group. 2.2 ppm 4.2 ppm 2.9 ppm 2.9 ppm 1.7 ppm 2.2 ppm H-ZSM-5 activated at 550 °C H-ZSM-5 activated at 900 °C 4.2 ppm 1.7 ppm without dephasing with dephasing 4.2 ppm 2.9 ppm 2.9 ppm 4.2 ppm difference spectra 10 8 6 4 2 2 4 10 8 6 4 2 0 2 4 0 / ppm / ppm
29Si MAS NMR spectrum of silicalite-1 SiO2 framework consisting of 24 crystallographic different silicon sites per unit cell (Fyfe 1987).
Determination of the Si/Al ratio by 29Si MAS NMR For Si/Al = 1 the Q4 coordination represents a SiO4 tetrahedron that is surrounded by four AlO4-tetrahedra, whereas for a very high Si/Al ratio the SiO4 tetrahedron is surrounded mainly by SiO4-tetrahedra. For zeolites of faujasite type the Si/Al-ratio goes from one (low silica X type) to very high values for the siliceous faujasite. Referred to the siliceous faujasite, the replacement of a silicon atom by an aluminum atom in the next coordination sphere causes an additional chemical shift of about 5 ppm, compared with the change from Si(0Al) with n = 4 to Si(4Al) with n = 0 in the previous figure. This gives the opportunity to determine the Si/Al ratio of the framework of crystalline aluminosilicate materials directly from the relative intensities In (in %) of the (up to five) 29Si MAS NMR signals by means of the equation Take-away message from this page: Framework Si/Al ratio can be determined by 29SiMAS NMR. The problem is that the signals for n = 0-4 are commonly not well-resolved and a signal of SiOH (Q3) at about -103 ppm is often superimposed to the signal for n = 1.
29Si MAS NMR shift and Si-O-Si bond angle a Considering the Q4 coordination alone, we find a spread of 37 ppm for zeolites in the previous figure. The isotropic chemical shift of the 29Si NMR signal depends in addition on the four Si-O bonding lengths and/or on the four Si-O-Si angles ai, which occur between neighboring tetrahedra. Correlations between the chemical shift and the arithmetical mean of the four bonding angles ai are best described in terms of The parameter r describes the s-character of the oxygen bond, which is considered to be an s-p hybrid orbital. For sp3-, sp2- and sp-hybridization with their respective bonding angles a = arccos(-1/3) 109.47°, a= 120°, a = 180°, the values r = 1/4, 1/3 and 1/2 are obtained, respectively. The most exact NMR data were published by Fyfe et al. for an aluminum-free zeolite ZSM-5. The spectrum of the low temperature phase consisting of signals due to the 24 averaged Si-O-Si angles between 147.0° and 158.8° (29Si NMR linewidths of 5 kHz) yielded the equation for the chemical shift Take away message from this page: Si-O-Si bond angle variations by a distortion of the short-range-order in a crystalline material broaden the 29Si MAS NMR signal of the material.
27Al MAS NMR shift and Al-O-T bond angle Aluminum signals of porous inorganic materials were found in the range -20 ppm to 120 ppm referring to Al(H2O)63+. The influence of the second coordination sphere can be demonstrated for tetrahedrally coordinated aluminum atoms: In hydrated samples the isotropic chemical shift of the 27Al resonance occurs at 75-80 ppm for aluminum sodalite (four aluminum atoms in the second coordination sphere), at 60 ppm for faujasite (four silicon atoms in the second coordination sphere) and at 40 ppm for AlPO4-5 (four phosphorous atoms in the second coordination sphere). In addition, the isotropic chemical shift of the AlO4 tetrahedra is a function of the mean of the four Al‑O‑T angles a (T = Al, Si, P). Their correlation is usually given as d /ppm = -c1 + c2. c1 was found to be 0.61 for the Al-O-P angles in AlPO4 by Müller et al. and 0.50 for the Si-O-Al angles in crystalline aluminosilicates by Lippmaa et al. Weller et al. determined c1-values of 0.22 for Al-O-Al angles in pure aluminate-sodalites and of 0.72 for Si-O-Al angles in sodalites with a Si/Al ratio of one. Aluminum has a nuclear spin I = 5/2, and the central transition is broadened by second-order quadrupolar interaction. This broadening is (expressed in ppm) reciprocal to the square of the external magnetic field. Line narrowing can in principle be achieved by double rotation or multiple-quantum procedures.
27Al 3QMAS NMR study of AlPO4-14 AlPO4-14, 27Al 3QMAS spectrum (split-t1-whole-echo, DFS pulse) measured at 17.6 T with a rotation frequency of 30 kHz. The parameters dCS, iso = 1.3 ppm, Cqcc = 2.57 MHz, h = 0.7 for aluminum nuclei at position 1, dCS, iso = 42.9 ppm, Cqcc = 1.74 MHz, h = 0.63, for aluminum nuclei at position 2, dCS, iso = 43.5 ppm, Cqcc = 4.08 MHz, h = 0.82, for aluminum nuclei at position 3, dCS, iso = 27.1 ppm, Cqcc = 5.58 MHz, h = 0.97, for aluminum nuclei at position 5, dCS, iso = -1.3 ppm, Cqcc = 2.57 MHz, h = 0.7 were taken from Fernandez et al.
six-fold coordinated four-fold coordinated five-fold coordinated nL = 195 MHz nRot =15 kHz nL = 130 MHz nRot =10 kHz 27Al MAS NMR spectra of a hydrothermally treated zeolite ZSM-5 Take-away message: A signal narrowing by MQMAS or DOR is not possible, if the line broadening is dominated by distributions of the chemical shifts which are caused by short-range-order distortions of the zeolite framework.
O O Al O O H H H H O O O O O O Al Al O O O O O Al Si Al Al- Si O O O O O O O O O O O O O O H H H NH4+ O O O O O O O O O O Si Si Al- Al- Al Al Si Si O O O O O O O O O O O O O O O O Mobility of the Brønsted sites and hydrogen exchange in zeolites one-site jumps around one aluminum atom multiple-site jumps along several aluminum atoms Proton mobility of bridging hydroxyl groups in zeolites H-Y and H-ZSM-5 can be monitored in the temperature range from 160 to 790 K. The full width at half maximum of the 1H MAS NMR spectrum narrows by a factor of 24 for zeolite H-ZSM-5 and a factor of 55 for zeolite 85 H-Y. Activation energies in the range 20-80 kJ mol-1 have been determined.
Narrowing onset and correlation time 40 °C 120°C 17 kHz dn = dnrigid/2 3,2 kHz dn = dnrigid/2 2H MAS NMR,deuterated zeolite H-ZSM-5, loaded with 0.33 NH3 per crossing 1H MAS NMR, zeolite H-Y, loaded with mit 0.6 NH3 per cavity The correlation time corresponds to the mean residence time of an ammonium ion at an oxygen ring of the framework. The correlation time corresponds to the mean residence time of an ammonium ion at an oxygen ring of the framework. 2H NMR, H-Y: at50 °C tc=5 µs 1H NMR, H-Y: at 40 °C tc=20 µs 2H NMR, H-ZSM-5: at 120 °C tc=3,8 µs
p/2 p/2 p/2 t2 t1 tm FID time 0 1D 1H EXSY (exchange spectroscopy) • EXSY pulse sequence Evolution time t1 = 1/4 Dn . Dn denotes the frequency difference of the exchanging species. MAS frequency should be a multiple of Dn Two series of measurements should be performed at each temperature: Offset Dn right of the right signal and offset Dn left of the left signal.
97 °C 0 10 d / ppm Result of the EXSY experiment • Stack plot of the spectra of zeolite H-Y loaded with 0.35 ammonia molecules per cavity. Mixing times are between tm = 3 ms and15 s. Intensities of the signals of ammonium ions and OH groups for zeolite H-Y loaded with 1.5 ammonia molecules per cavity. Measured at 87 °C in the field of 9,4 T. The figure on the top and bottom correspond to offset on the left hand side and right hand side of the signals, respectively.
Basis of the data processing diagonal peaks cross peaks dynamic matrix (without spin diffusion):
Laser supported 1H MAS NMR of H-zeolites Spectra (at left) and Arrhenius plot (above) of the temperature dependent 1H MAS NMR measurements which were obtained by laser heating. The zeolite sample H-Y was activated at 400 °C.
Proton transfer between Brønsted sites and benzene molecules in zeolites H-Y In situ1H MAS NMR spectroscopy of the proton transfer between bridging hydroxyl groups and benzene molecules yields temperature dependent exchange rates over more than five orders of magnitude. H-D exchange and NOESY MAS NMR experiments were performed by both conventional and laser heating up to 600 K.
Exchange rate as a dynamic measure of Brønsted acidity Arrhenius plot of the H-D and H-H exchange rates for benzene molecules in the zeolites 85 H-Y and 92 H-Y. The values which are marked by blue or red were measured by laser heating or conventional heating, respectively. The variation of the Si/Al ratio in the zeolite H-Y causes a change of the deprotonation energy and can explain the differences of the exchange rate of one order of magnitude in the temperature region of 350600 K. However, our experimental results are not sufficient to exclude that a variation of the pre-exponential factor caused by steric effects like the existence of non-framework aluminum species is the origin of the different rates of the proton transfer.
In situ monitoring of catalytic conversion of molecules in zeolites by 1H, 2H and 13C MAS NMR 13C CP/MAS NMR spectra of [2-13C]-n-but-1-ene adsorption on H-FER in dependence on reaction time. Asterisks denote spinning side-bands.The appearance of the signals at 13 and 17 ppm and decreasing intensity of the signal at 126 ppm show the label scrambling. 2H MAS NMR spectra of n-but-1-ene-d8 adsorbed on H‑FER (T = 333K). n-But-1-ene undergoes readily a double-bond-shift reaction, when it is adsorbed on ferrierite. The reaction becomes slow enough to observe the kinetics , if the catalyst contains only a very small concentration of Brønsted acid sites. 1H MAS NMR spectra of n-but-1-ene-d8 adsorbed on H-FER2 (T=360K). Hydrogen transfer occurs from the acidic hydroxyl groups of the zeolite to the deuterated butene molecules. Both methyl and methene groups of but-2-ene are involved in the H/D exchange. The ratio between the intensities of the CH3 and CH groups in the final spectrum is 3:1. Kinetics of a double-bond-shift reaction, hydrogen exchange and 13C-label scrambling of n-butene in H-ferrierite
rotor with sample in the rf coil zr B0 rot θm gradient coil p/2 p p/2 p/2 p p/2 p/2 MAS PFG NMR diffusion experiment g gradient pulses d / ppm 1.0 2.0 CH3 (iso) rf pulses CH3 (n-but) Δδ= 0.4 ppm CH2(n-but) ωr = 0 kHz FID CH (iso) r. f. ωr = 1 kHz * * * gradient strength * * * 4 2 0 -2 t t t t d / ppm g g pulses δ = 0.02 ppm Gz ωr = 10 kHz d d FAU Na-X , n-butane + isobutane Δδ 2.0 1.5 1.0 0.5 d / ppm t T ecd D MAS PFG NMR for NMR diffusometry
MAS PFG NMR studies of the self-diffusion of acetone-alkane mixtures in nanoporous silica gel The self-diffusion coefficients of mixtures of acetone with several alkanes were studied by means of magic-angle spinning pulsed field gradient nuclear magnetic resonance (MAS PFG NMR). Silica gels with different nanopore sizes at ca. 4 and 10 nm and a pore surface modified with trimethylsilyl groups were provided by Takahashi et al. (1). The silica gel was loaded with acetone –alkane mixtures (1:10). The self-diffusion coefficients of acetone in the small pores (4 nm) shows a zigzag effect depending on odd or even numbers of carbon atoms of the alkane solvent as it was reported by Takahashi et al. (1) for the transport diffusion coefficient. (1) Ryoji Takahashi, Satoshi Sato, Toshiaki Sodesawa and Toshiyuki Ikeda: Diffusion coefficient of ketones in liquid media within mesopores;Phys. Chem. Chem. Phys.5 (2003) 2476–2480
octane CH2 CH3 acetone CH3 gradient strength 2.8 2.4 2.0 1.6 1.2 0.8 0.4 d / ppm Stack plot of the 1H MAS PFG NMR spectra at 10 kHz of the 1:10 acetone and octane mixture absorbed in Em material as function of increasing pulsed gradient strength for a diffusion time D = 600 ms: Semi-logarithmic plot of the decay of the CH3 signal of ketone in binary mixture with acetone at 298 K. The diffusion time isD = 600 ms and a gradient pulse length is d = 2 ms: Diffusion coefficient of acetone in mixture within Emin dependence of the number of carbons in the alkane solvent. The measurements were carried out with diffusion timeD= 600 ms, D = 800 ms and D = 1200 ms and the gradient pulse length d= 2 ms.
Horst ErnstMoisés Fernández Clemens Gottert Johanna Kanellopoulos Bernd KnorrThomas LoeserToralf Mildner Lutz Moschkowitz Dagmar Prager Denis Schneider Alexander Stepanov Deutsche Forschungsgemeinschaft Max-Buchner-Stiftung I acknowledge support from