Download
1 / 95
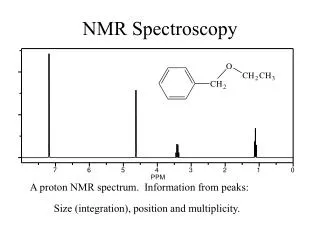
1.31k likes | 2.94k Views
NMR Spectroscopy. CHEM 430. Spin-Lattice and Spin-Spin Relaxation. T 1 relaxation: Remember that spin –lattice , or longitudinal, relaxation returns the system to equilibrium along the z axis, with time constant T 1 and rate constant R 1 = (1/T 1 )

E N D
NMR Spectroscopy CHEM 430
Spin-Lattice and Spin-Spin Relaxation • T1 relaxation: Remember that spin–lattice, or longitudinal, relaxation returns the system to equilibrium along the z axis, with time constant T1 and rate constant R1 = (1/T1) • T2 relaxation is due primarily to scalar coupling (J-coupling) by the Fermi contact mechanism. T2 relaxation is in the component of relaxation in the x-y plane. • By definition T2 < T1 From: Hornack, J.P., http://www.cis.rit.edu/htbooks/nmr/ CHEM 430 – NMR Spectroscopy
Spin-Lattice and Spin-Spin Relaxation • T1 relaxation: The first T1 is observed when placing the sample in the magnet! The initial bulk magnetization has a time constant of T1! • Knowledge of T1 is important. When using FT-NMR techniques, the time between pulses must allow for full relaxation of the nuclei. © Copyright Hans J. Reich 2013 © Copyright Hans J. Reich 2013 CHEM 430 – NMR Spectroscopy
Spin-Lattice and Spin-Spin Relaxation Measurement of Relaxation Time. • A convenient method has been developed for measuring T1: inversion recovery. • A series of NMR spectra are measured in which the spins are inverted with a 180opulse, followed by a variable waiting period τ. • A second 90o pulse allows one to measure the amount of decay of the z-component at this time τ: CHEM 430 – NMR Spectroscopy
Spin-Lattice and Spin-Spin Relaxation Measurement of Relaxation Time. © Copyright Hans J. Reich 2013 CHEM 430 – NMR Spectroscopy
Spin-Lattice and Spin-Spin Relaxation Measurement of Relaxation Time. For each of the six carbons in chlorobenzene, note when the signal is nulled. That is T1 ! CHEM 430 – NMR Spectroscopy
Spin-Lattice and Spin-Spin Relaxation • Observation: • T1 relaxation times are longest for small and very large molecules. • T1 relaxation times are lengthened by higher field instruments, in general. • T1 relaxation minima is shifted towards smaller molecules on higher field instruments. © Copyright Hans J. Reich 2013 CHEM 430 – NMR Spectroscopy
Spin-Lattice and Spin-Spin Relaxation • Observation: • tCor correlation time is a measure of the rotation and translational rates of molecules in solution. • By definition this rate will approach zero in highly viscous systems and solids. © Copyright Hans J. Reich 2013 CHEM 430 – NMR Spectroscopy
Spin-Lattice and Spin-Spin Relaxation Causes of Relaxation. • T1relaxation occurs because of the presence of natural magnetic fields in the sample that fluctuate at the Larmor frequency--excess spin energy can flow into the molecular surroundings or lattice • The rate of spontaneous relaxation of nuclear spin orientations is practically zero. From: Hornack, J.P., http://www.cis.rit.edu/htbooks/nmr/ CHEM 430 – NMR Spectroscopy
Spin-Lattice and Spin-Spin Relaxation Causes of Relaxation. • The major source of these magnetic fields is magnetic nuclei in motion or the process of Dipole-Dipole Relaxation (DD) • It involves the interaction of the resonating nuclear magnetic dipole with the dipole of the nucleus in motion that causes the fluctuating field of the lattice. From: Hornack, J.P., http://www.cis.rit.edu/htbooks/nmr/ CHEM 430 – NMR Spectroscopy
Spin-Lattice and Spin-Spin Relaxation • Correlation time (τc) for a molecule can be defined as roughly the interval between two successive reorientations or positional changes of the molecule (by vibration, rotation or translation) • The correlation time for small molecules is of the order of 10-12 sec in solution (longer in viscous solvents). • For a proton at 300 MHz, νo ≈ 108, most molecules below molecular weight of 1000 are moving too rapidly for effective relaxation. CHEM 430 – NMR Spectroscopy
Spin-Lattice and Spin-Spin Relaxation • The resulting relaxation time depends on • The number of nearby nuclei - n • Nuclear properties of both resonating and moving nuclei, g • Distance between them, r -6 • Correlation time: tc • Mathematically for 13C relaxed by protons: • Mathematically for protons relaxed by protons: CHEM 430 – NMR Spectroscopy
Spin-Lattice and Spin-Spin Relaxation • 13C relaxation is faster when • There are more attached protons • The internucleardistance C—H is less • When rotation in solution decreases • Quaternary 13Chas a long relaxation time because it lacks an attached proton and because the distance rCH to other protons is large. • The ratio of the 13C relaxation time of CH to CH2to CH3is 6: 3: 2 (1: ½ :⅓), • Because the rate of molecular tumbling in solution slows as molecular size increases, larger molecules relax more rapidly. • Thus, cholesteryl chloride relaxes more rapidly than phenanthrene, which relaxes more rapidly than benzene. CHEM 430 – NMR Spectroscopy
Spin-Lattice and Spin-Spin Relaxation • The previous equations are an approximation to a more complete equation and represents what is called the extreme narrowing limit for smaller molecules. • Because the frequency of motion of the moving nuclear magnet must match the resonance frequency of the excited nuclear magnet, dipolar relaxation becomes ineffective for both rapidly moving small molecules and slowly moving large molecules. • Many molecules of interest to biochemists fall into the latter category, • Similarly rapid internal rotation of methyl groups in small molecules also can reduce the effectiveness of dipole– dipole relaxation. • The optimal correlation times tc for dipolar relaxation lie in the range of 10-7 to 10-11 s (inverse of the resonance frequency). CHEM 430 – NMR Spectroscopy
Spin-Lattice and Spin-Spin Relaxation Structural Ramifications. • Proton spin– lattice relaxation times depend on the distance between the resonating nucleus and the nearest- neighbor protons. • The closer the neighbors are, the faster is the relaxation - shorter T1. • The two isomers (anomers) below may be distinguished by their proton relaxation times: • H1 is eq with more distant neighbors: T1 of 4.1 s. H1 is ax and close to the 3 and 5 ax protons, T1 of 2.0 s CHEM 430 – NMR Spectroscopy
Spin-Lattice and Spin-Spin Relaxation • When dipolar relaxation is slow, other mechanisms of relaxation become important. Fluctuating magnetic fields also can arise from: • Interruption of the motion of rapidly tumbling small molecules or rapidly rotating groups within a molecule ( spin rotation relaxation), • Tumbling of molecules with anisotropic chemical shielding at high fields • Scalar coupling constants that fluctuate through chemical exchange or through quadrupolarinteractions • Tumbling of paramagnetic molecules (unpaired electrons have very large magnetic dipoles) • Tumbling of quadrupolarnuclei • In the absence of quadrupolar nuclei or paramagnetic species, these alternative mechanisms often are unimportant. CHEM 430 – NMR Spectroscopy
Spin-Lattice and Spin-Spin Relaxation Anisotropic Motion. • When a molecule is rigid and rotates equally in any direction (isotropically), all the carbon relaxation times (after adjustment for the number of attached protons) should be nearly the same. • The non-spherical shape of a molecule, however, frequently leads to preferential rotation in solution around one or more axes (anisotropic rotation). Example: toluene rotates around the long axis so that less mass is in motion. On average, these carbons (and their attached protons) move less in solution than the ortho and meta carbons, because atoms on the axis of rotation remain stationary during rotation. CHEM 430 – NMR Spectroscopy
Spin-Lattice and Spin-Spin Relaxation Segmental Motion. • When molecules are not rigid, the more rapidly moving pieces relax more slowly because their tc is shorter. • Example: In decane the methyl carbon relaxes most slowly, followed by the ethyl carbon, and so on, to the fifth carbon in the middle of the chain. • The structure gives the values of nT1 (n = # of attached protons), So these values reflect the relative rates of motion of each carbon with the attached protons normalized out: CHEM 430 – NMR Spectroscopy
Spin-Lattice and Spin-Spin Relaxation Partially Relaxed Spectra. • The inversion recovery experiment used to measure T1 also may be exploited to simplify spectra: In the inversion recovery example the spectrum for t = 40 s lacks the ipso carbon resonance • Such partially relaxed spectra can be used not only to obtain partial spectra in this fashion but also to eliminate specific peaks. • When D2O is used as the solvent, the residual HOD peak is undesirable. An inversion recovery experiment can reveal the value of for which the water peak is nulled. • Solvent suppression: Apply the 180° pulse selectively only at the resonance position of water. Selection of t for nulling of this peak then produces a spectrum that lacks the water peak but otherwise is quite normal for the remaining resonances. CHEM 430 – NMR Spectroscopy
Spin-Lattice and Spin-Spin Relaxation Partially Relaxed Spectra – Solvent Suppression 2mM Sucrose in H2O:D2O 9:1 HOD CHEM 430 – NMR Spectroscopy
Spin-Lattice and Spin-Spin Relaxation Quadrupolar Relaxation. • The dominant mode of spin– lattice relaxation for nuclei with spins greater than ½ results from the quadrupolar nature of such nuclei. • These nuclei are considered to have an ellipsoidal rather than a spherical shape. When I = 1, as for 14N or 2H, there are three stable orientations in the magnetic field: parallel, orthogonal, and antiparallel: • When these ellipsoidal nuclei tumble in solution within an unsymmetrical electron cloud of the molecule, they produce a fluctuating electric field that can bring about relaxation. CHEM 430 – NMR Spectroscopy
Spin-Lattice and Spin-Spin Relaxation Quadrupolar Relaxation. • The mechanism is different from dipole–dipole relaxation in two ways. • It does not require a second nucleus in motion; the quadrupolar nucleus creates its own fluctuating field by moving in the unsymmetrical electron cloud. • Because the mechanism is extremely effective when the quadrupole moment of the nucleus is large, T1 can become very short ( < milliseconds). • By the uncertainty principle the product of DE and t must remain constant: (DE·t ~ h) ∴when the relaxation time is very short, the linewidth becomes very large. • Nuclei with large quadrupole moments often exhibit very large linewidths— for example, about 20,000 Hz for the 35Cl resonance of CCl4. CHEM 430 – NMR Spectroscopy
Spin-Lattice and Spin-Spin Relaxation Quadrupolar Relaxation. • The common nuclides 17O and 14N have smaller quadrupolar moments and exhibit sharper resonances, typically tens of hertz. • The linewidth also depends on the symmetry of the molecule, which controls how unsymmetrical the electron cloud is. Systems with p electrons are more unsymmetrical and give broader lines CHEM 430 – NMR Spectroscopy
Reactions on the NMR Time Scale • NMR is an excellent tool for following the kinetics of an irreversible reaction traditionally through the disappearance or appearance of peaks over periods of minutes to hours. • The spectrum is recorded repeatedly at specific intervals, and rate constants are calculated from changes in peak intensities. • Thus, the procedure is a classical kinetic method, performed on the laboratory time scale. • The molecular changes take place on a time scale much longer than the pulse or acquisition times of the NMR experiment. CHEM 430 – NMR Spectroscopy
Reactions on the NMR Time Scale • More importantly, NMR has the unique capability for study of the kinetics of reactions that occur at equilibrium and that affect line shapes: • EA in the range from 4.5 to 25 kcal·mol-1 • Rates in the range from 100 to 104s-1. • This NMR time scale refers to the rough equivalence of the reaction rate in s-1to the frequency spacing in Hz • Remember the study of axial and equatorial protons in cyclohexane-d11 as a function of temperature: • When interchange of two such chemical environments occurs faster than the frequency differences between the two sites, the result is a single peak • When the interchange is slower than the frequency differences, the NMR result is two distinct peaks CHEM 430 – NMR Spectroscopy
Reactions on the NMR Time Scale Hindered Rotation. • Normally, rotation around single bonds has a barrier below 5 kcal·mol-1 - faster than the NMR time scale. • Rotation around the double bond of alkenes, on the other hand, has a barrier that is normally above 50 kcal·mol-1and is slow on the NMR time scale. • There are numerous examples of intermediate bond orders, whose rotation occurs within the NMR time scale. Hindered rotation about the bond in amides such as N,N-dimethylformamide provides a classic example of site exchange: • RT - exchange is slow and two CH3 resonances are observed, • > 100° C, exchange is fast and a single resonance is observed. • Measured barrier is about 22 5 kcal·mol-1. CHEM 430 – NMR Spectroscopy
Reactions on the NMR Time Scale Hindered Rotation. • Hindered rotation occurs on the NMR time scale for numerous other systems with partial double bonds, including carbamates, thioamides, enamines, nitrosamines, alkyl nitrites, diazoketones, aminoboranes, and aromatic aldehydes. • Formal double bonds can exhibit free rotation when alternative resonance structures suggest partial single bonding. • Calicenehas a barrier to rotation about the central bond of 20 kcal·mol-1: CHEM 430 – NMR Spectroscopy
Reactions on the NMR Time Scale Hindered Rotation. • Steric congestion can raise the barrier about a single bond enough to bring it into the NMR range. • Rotation about the single bond in the biphenyl shown is raised to a measurable 13 kcal·mol-1 by the presence of the ortho- substituents, which also provide diastereotopic methylene protons as the dynamic probe: CHEM 430 – NMR Spectroscopy
Reactions on the NMR Time Scale Hindered Rotation. • Hindered rotation about an s–bond can sometimes be observed when at least one of the carbons is quaternary. • Example: At – 150 °C the tert-butyl group in tert-butylcyclopentane gives two resonances in the ratio of 2: 1, since two of the methyl groups are different from the third C : CHEM 430 – NMR Spectroscopy
Reactions on the NMR Time Scale Hindered Rotation. • Hindered rotation has frequently been observed in halogenated alkanes. • The barrier probably arises from a combination of steric and electrostatic interactions. 2,2,3,3-Tetrachlorobutane at - 40° C exhibits a 2: 1 doublet below from anti and gaucherotamers that are rotating slowly on the NMR time scale.: • When both atoms about a s-bond possess lone electron pairs, the barrier often (due to electrostatic interactions or repulsions) is often observable; for example the S—S bond in dibenzyl disulfide 7 kcal·mol-1 . CHEM 430 – NMR Spectroscopy
Reactions on the NMR Time Scale Ring Reversal. • Axial-equatorial interconversion through ring reversal has been studied in a wide variety of systems in addition to cyclohexane: • 8-membered rings such as cyclooctane have been examined extensively; The d15-derivative exhibits dynamic behavior below - 100° C, with an EA of 7.7 kcal·mol-1. • Cyclooctatetraene undergoes a boat–boat ring reversal. side chain methyl groups provide the diastereotopic probe to estimate the barrier of 14.7 kcal·mol-1. CHEM 430 – NMR Spectroscopy
Reactions on the NMR Time Scale Atomic Inversion. • Trisubstitutedatoms with a lone pair, such as amines, may undergo the process of pyramidal atomic inversion on the NMR time scale. • The resonances of the two methyls in the aziridinebecome equivalent at elevated temperatures through rapid N-inversion. • The high barrier of 18 kcal·mol-1 is due to angle strain in the three- membered ring, which is higher in the transition state • The effect is observed to a lesser extent in azetidines(9 kcal·mol-1) and in strained bicyclic systems (10 kcal·mol-1). CHEM 430 – NMR Spectroscopy
Reactions on the NMR Time Scale Atomic Inversion. • The inversion barrier may be raised when nitrogen is attached to highly electronegative elements. • This substitution increases the s character of the ground- state lone pair. Since the transition- state lone pair must remain p- hybridized, the barrier is higher, as in N- chloropyrrolidine: • When neither ring strain nor electronegative substituents are present, barriers are lower, as in N- methylazacycloheptane7 kcal·mol-1 CHEM 430 – NMR Spectroscopy
Reactions on the NMR Time Scale Atomic Inversion. • Inversion barriers for elements in lower rows of the periodic table generally are above the NMR range: chiral phosphines and sulfoxides are isolable. • Barriers must be brought into the observable NMR range by substitution with electropositive elements, as in diphosphine CH3(C6H5)P—P(C6H5)CH3, with a barrier of 26 kcal·mol- 1 • The barrier in phospholeis lowered because the transition state is aromatic. Compare its barrier of 16 kcal·mol- 1 to 36 kcal·mol- 1 in a saturated analogue: CHEM 430 – NMR Spectroscopy
Reactions on the NMR Time Scale Valence Tautomerizations and Bond Shifts. • The barriers to many valence tautomerizationsfall into the NMR range. • A classic example is the Cope rearrangement of 3,4- homotropilidine, at low temperatures, the spectrum has the features expected for the five functionally distinct types of protons (disregarding diastereotopic differ-ences). • At higher temperatures, the rearrangement becomes fast on the NMR time scale, and only three types of resonances are observed (barrier of 14 kcal·mol- 1for the 1,3,5,7- tetramethyl derivative). CHEM 430 – NMR Spectroscopy
Reactions on the NMR Time Scale Valence Tautomerizations and Bond Shifts. • When a third bridge is added, as in barbaralone steric requirements of the rearrangement are improved, and the barrier is lowered to 9.6 kcal·mol- 1. • When the third bridge is an ethylenic group, the molecule is bullvalenewhere all three bridges are identical, and a sequence of Cope rearrangements renders all protons (or carbons) equivalent. • Indeed, the complex spectrum at room temperature becomes a singlet above 180 oC. • Molecules that undergo rapid valence tautomerizations often are said to be fluxional. CHEM 430 – NMR Spectroscopy
Reactions on the NMR Time Scale Valence Tautomerizations and Bond Shifts. • Rearrangements of carbocations also may be studied by NMR methods. • The norbornylcationmay undergo 3,2-and 6,2-hydride shifts, as well as Wagner–Meerwein rearrangements. • The sum of these processes renders all protons equivalent, so that the complex spectrum below -80 oC becomes a singlet at room temperature. • The slowed process appears to be the 3,2- hydride shift, whose barrier was measured to be 11 kcal·mol- 1 CHEM 430 – NMR Spectroscopy
Reactions on the NMR Time Scale Valence Tautomerizations and Bond Shifts. • Fluxional organometallic species have also been observed with NMR • Tetra-methylalleneirontetracarbonylexhibits three distinct methyl resonances in the ratio 1: 1: 2 at - 60° as depicted: • Above room temperature, however, the spectrum becomes a singlet as the Fe(CO)4 unit circulates about the allenic structure by moving orthogonally from one alkenic unit to the other. CHEM 430 – NMR Spectroscopy
Reactions on the NMR Time Scale Valence Tautomerizations and Bond Shifts. • In cyclooctatetreneirontricarbonyl, the spectrum below –150 °C indicates four protons on carbons bound to iron and four on carbons not bound to iron, consistent with the structure shown. • Above –100 °C all the protons converge to a singlet as the iron atom moves around the ring as shown. • A bond shift occurs with each 45° movement of the iron atom. Eight such operations result in complete averaging of the ring protons or carbons. CHEM 430 – NMR Spectroscopy
Reactions on the NMR Time Scale Quantification. • For the simple case of two equally populated sites that do not exhibit coupling (ex: cyclohexane) the rate constant (kc) at the point of maximum peak broadening (the coalescence temperature Tc, d11 approximately - 60° C) is kc= pDn/ √2 • Dnis the distance in Hz between the two peaks at slow exchange. • The free energy of activation then may be calculated as DGc‡ = 2.3RTc [10.32 + log(Tc / kc )] • This result is extremely accurate and easy to obtain, but the equation is limited in its application. CHEM 430 – NMR Spectroscopy
Reactions on the NMR Time Scale Quantification. • For the two- site exchange between coupled nuclei the rate constant at Tc kc = p(Dn2 + 6J2)½ / √2 • To include unequal populations, more complex coupling patterns, and more than two exchange sites, it is necessary to use computer programs such as DNMR3, which can simulate the entire line shape at several temperatures. • Such a procedure generates Arrhenius plots from which enthalpic and entropic activation parameters may be obtained. • The procedure is more elegant and more comprehensive, but it is more susceptible to systematic errors involving inherent linewidths and peak spacings than is the coalescence temperature method. CHEM 430 – NMR Spectroscopy
Reactions on the NMR Time Scale Quantification. • The proportionality between kc and Dn means that the rate constant is dependent on the field strength • Thus, a change in field from 300 to 600 MHz alters the rate constant at Tc. The practical result is that changes. • Since the slow exchange peaks are farther apart at 600 MHz, a higher temperature is required to achieve coalescence than at 300 MHz. • At a given field strength, two nuclides such as and have different values of for Dnanalogous functionalities and achieve coalescence at different temperatures. • Since Dnis usually larger for than 1H than for 13C the coalescence temper-ature often is much higher for 13C. CHEM 430 – NMR Spectroscopy
Multiple Resonance • Special effects may be routinely and elegantly created by using sources of radiofrequency energy in addition to the observation frequency , n1 = gB1 • The technique is called multiple irradiation or multiple resonance and requires the presence of a second transmitter coil in the sample probe to provide the new irradiating frequency n2= gB2 • When the second frequency is applied, the experiment, which is widely available on modern spectrometers, is termed double resonance or double irradiation. • We already have seen several examples of double irradiation experiments, including the removal of proton couplings from 13C, the elimination of solvent peaks by peak suppression, the sharpening of NH resonances by irradiation of 14N. CHEM 430 – NMR Spectroscopy
Multiple Resonance Spin Decoupling. • One of the oldest and most generally applicable double-resonance experiments is the irradiation of one proton resonance (HX) and observation of the effects on the AX coupling (JAX) present in another proton resonance (HA). • The traditional and intuitive explanation for the resulting spectral simplification, known as spin decoupling, is that the irradiation shuttles the X protons between the spin states so rapidly that the A protons no longer have a distinguishable independent existence. • As a result, the A resonance collapses to a singlet. This explanation, however, is inadequate in that it fails to account for phenomena at weak decoupling fields (spin tickling) and even some phenomena at very strong decoupling fields. CHEM 430 – NMR Spectroscopy
Multiple Resonance Spin Decoupling. • The actual experiment involves getting the coupled nuclei to precess about orthogonal axes. • The magnitude of the coupling interaction between two spins is expressed by the scalar, or dot, product between their magnetic moments and is proportional to the expression: Jm1 · m2 = Jm1m2cosf • The quantity f is the angle between the vectors (the axes of precession of the nuclei). • So long as both sets of nuclei precess around the same (z) axis, f is zero, cos 0o is 1, and full coupling is observed. CHEM 430 – NMR Spectroscopy
Multiple Resonance Spin Decoupling. • The geometrical relationship between the spins may be altered by subjecting one of them to a B2 field. • Imagine observing 13C nuclei as they precess around the z axis at the frequency B2. • When the attached protons are subjected to a strong B2 field along the x axis, they will precess around that axis. • The angle f between the 1H and 13C nuclear vectors is 90° as they respectively precess around the z and x axes. • As a result, their spin– spin interaction goes to zero because the dot product is zero . The nuclei are then said to be decoupled. CHEM 430 – NMR Spectroscopy
Multiple Resonance Spin Decoupling. • Spin decoupling has been useful in identifying coupled pairs of nuclei. • Consider ethyl trans-crotonate, the alkenic protons split each other, and both are split by the allylic methyl group to form an ABX3 spin system. • Irradiation at the methyl resonance frequency produces the upper spectrum in the inset for the alkenic protons, which have become a simple AB quartet. CHEM 430 – NMR Spectroscopy
Multiple Resonance Spin Decoupling. • A more complex example is illustrated using the bicyclic sugar mannosan triacetate, which has a nearly first-order spectrum with numerous coupling partners. • Irradiation of H5 @ d 4.62 produces simplification of the resonances of its vicinal partners H4, H6/1 H6/2 as well as its long- range zigzag partner H3: CHEM 430 – NMR Spectroscopy
Multiple Resonance Difference Decoupling. • In complex molecules, the difference between coupled and decoupled spectracan be used as a probe for nuclear relationships • Features that are not affected by decoupling are subtracted out and do not appear. • The procedure provides coupling relationships when spectral overlap is a serious problem. • This and other simple spin-decoupling experiments have been entirely superseded by two- dimensional experiments in recent years CHEM 430 – NMR Spectroscopy
Multiple Resonance Difference Decoupling. • Consider the 1H spectrum of 1- dehydrotestosterone: b) irradiation of the 6 resonance shows little change as the result of double irradiation. But if the original spectrum (a) is subtracted from (b), the remaining resonances must be from the effect of the 7 protons (c). CHEM 430 – NMR Spectroscopy