Download
1 / 1
10 likes | 115 Views
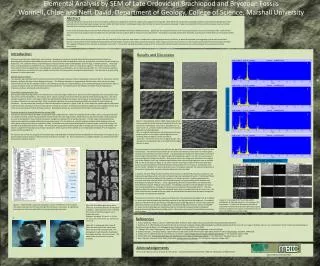
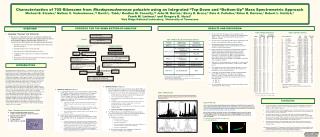
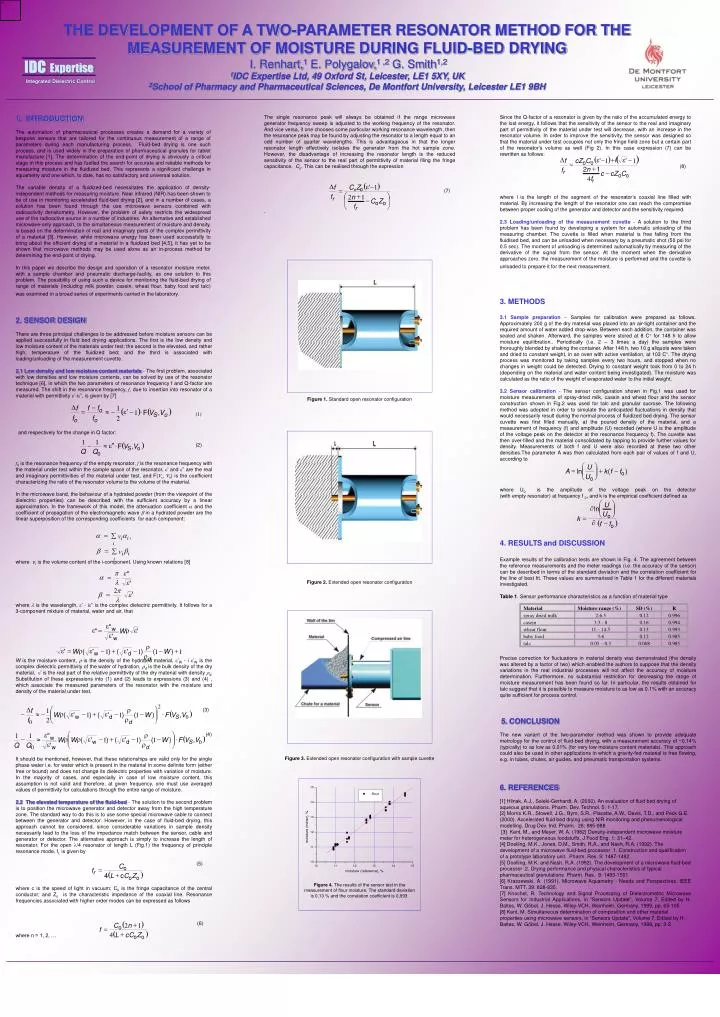
Material. Moisture range (%). SD (%). R. spray dried milk. 2-6.5. 0.12. 0.996. casein. 3.5 - 8. 0.16. 0.994. wheat flour. 11 – 14.5. 0.13. 0.993. IDC. Expertise. baby food. 3-6. 0.12. 0.985. Integrated Dielectric Control. talc. 0.05 – 0.3. 0.008. 0.985.

E N D
Material Moisture range (%) SD (%) R spray dried milk 2-6.5 0.12 0.996 casein 3.5 - 8 0.16 0.994 wheat flour 11 – 14.5 0.13 0.993 IDC • Expertise baby food 3-6 0.12 0.985 Integrated Dielectric Control talc 0.05 – 0.3 0.008 0.985 THE DEVELOPMENT OF A TWO-PARAMETER RESONATOR METHOD FOR THE MEASUREMENT OF MOISTURE DURING FLUID-BED DRYINGI. Renhart,1 E. Polygalov,1 ,2 G. Smith1,2 1IDC Expertise Ltd, 49 Oxford St, Leicester, LE1 5XY, UK 2School of Pharmacy and Pharmaceutical Sciences, De Montfort University, Leicester LE1 9BH 1. INTRODUCTION The automation of pharmaceutical processes creates a demand for a variety of bespoke sensors that are tailored for the continuous measurement of a range of parameters during each manufacturing process. Fluid-bed drying is one such process, and is used widely in the preparation of pharmaceutical granules for tablet manufacture [1]. The determination of the end-point of drying is obviously a critical stage in this process and has fuelled the search for accurate and reliable methods for measuring moisture in the fluidized bed. This represents a significant challenge in aquametry and one which, to date, has no satisfactory and universal solution. The variable density of a fluidized-bed necessitates the application of density-independent methods for measuring moisture. Near infrared (NIR) has been shown to be of use in monitoring accelerated fluid-bed drying [2], and in a number of cases, a solution has been found through the use microwave sensors combined with radioactivity densitometry. However, the problem of safety restricts the widespread use of the radioactive source in a number of industries. An alternative and established microwave-only approach, to the simultaneous measurement of moisture and density, is based on the determination of real and imaginary parts of the complex permittivity of a material [3]. However, while microwave energy has been used successfully to bring about the efficient drying of a material in a fluidized bed [4,5], it has yet to be shown that microwave methods may be used alone as an in-process method for determining the end-point of drying. In this paper we describe the design and operation of a resonator moisture meter, with a sample chamber and pneumaticdischarge-facility, as one solution to this problem. The possibility of using such a device for monitoring the fluid-bed drying of range of materials (including milk powder, casein, wheat flour, baby food and talc) was examined in a broad series of experiments carried in the laboratory. The single resonance peak will always be obtained if the range microwave generator frequency sweep is adjusted to the working frequency of the resonator. And vice versa, if one chooses some particular working resonance wavelength, then the resonance peak may be found by adjusting the resonator to a length equal to an odd number of quarter wavelengths.This is advantageous in that the longer resonator length effectively isolates the generator from the hot sample zone. However, the disadvantage of increasing the resonator length is the reduced sensitivity of the sensor to the real part of permittivity of material filing the fringe capacitance,Co. This can be realised through the expression (7) . Since the Q-factor of a resonator is given by the ratio of the accumulated energy to the lost energy, it follows that the sensitivity of the sensor to the real and imaginary part of permittivity of the material under test will decrease, with an increase in the resonator volume. In order to improve the sensitivity, the sensor was designed so that the material under test occupies not only the fringe field zone but a certain part of the resonator’s volume as well (Fig 2). In this case expression (7) can be rewritten as follows: (8) where lis the length of the segment of the resonator’s coaxial line filled with material. By increasing the length of the resonator one can reach the compromise between proper cooling of the generator and detector and the sensitivity required. 2.3 Loading/unloading of the measurement cuvette - A solution to the third problem has been found by developing a system for automatic unloading of the measuring chamber. The cuvette is filled when material is free falling from the fluidised bed, and can be unloaded when necessary by a pneumatic shot (50 psi for 0.5 sec).The moment of unloading is determined automatically by measuring of the derivative of the signal from the sensor. At the moment when the derivative approaches zero, the measurement of the moisture is performed and the cuvette is unloaded to prepare it for the next measurement. ( ) ( ) e - +l e - D cZ C ' ' f 1 1 o o = + 2 n 1 f - r c cZ C o o f 4 r ( ) e - D CoZ ' f 1 o = æ ö + f n 2 1 r - ç ÷ C Z o o f è ø r 3. METHODS 3.1 Sample preparation-Samples for calibration were prepared as follows. Approximately 200 g of the dry material was placed into an air-tight container and the required amount of water added drop-wise. Between each addition, the container was sealed and shaken. Afterward, the samples were stored at 8 C for 148 h to allow moisture equilibration.. Periodically (i.e. 2 – 3 times a day) the samples were thoroughly blended by shaking the container. After 148 h, two 10 g aliquots were taken and dried to constant weight, in an oven with active ventilation, at 103 C. The drying process was monitored by taking samples every two hours, and stopped when no changes in weight could be detected. Drying to constant weight took from 0 to 24 h (depending on the material and water content being investigated). The moisture was calculated as the ratio of the weight of evaporated water to the initial weight. 3.2 Sensor calibration - The sensor configuration shown in Fig.1 was used for moisture measurements of spray-dried milk, casein and wheat flour and the sensor construction shown in Fig.2 was used for talc and granular sucrose. The following method was adopted in order to simulate the anticipated fluctuations in density that would necessarily result during the normal process of fluidized bed drying. The sensor cuvette was first filled manually, at the poured density of the material, and a measurement of frequency (f) and amplitude (U) recorded (where U is the amplitude of the voltage peak on the detector at the resonance frequency f). The cuvette was then over-filled and the material consolidated by tapping to provide further values for density. Measurements of both f and U were also recorded at these two other densities.The parameter A was then calculated from each pair of values of f and U, according to where U0 is the amplitude of the voltage peak on the detector (with empty resonator) at frequency f 0, and k is the empirical coefficient defined as • 2. SENSOR DESIGN • There are three principal challenges to be addressed before moisture sensors can be applied successfully in fluid bed drying applications. The first is the low density and low moisture content of the materials under test; the second is the elevated, and rather high, temperature of the fluidized bed; and the third is associated with loading/unloading of the measurement cuvette. • 2.1 Low density and low moisture content materials - The first problem, associated with low densities and low moisture contents, can be solved by use of the resonator technique [6], in which the two parameters of resonance frequency f and Q-factor are measured. The shift in the resonance frequency, f, due to insertion into resonator of a material with permittivity’-i”, is given by [7] • (1) • and respectively for the change in Q factor: • (2) • f0is theresonancefrequencyof the emptyresonator, fis the resonancefrequencywith the material under test within the sample space of the resonator, ’and ” are the real and imaginary permittivitiesofthematerial under test, and F(Vs, V0) is thecoefficientcharacterizing the ratio of the resonator volume to the volume of the material. • In the microwave band, the behaviour of a hydrated powder (from the viewpoint of the dielectric properties) can be described with the sufficient accuracy by a linear approximation. In the framework of this model, the attenuation coefficient and the coefficient of propagation of the electromagnetic wave in a hydrated powder are the linear superposition of the corresponding coefficients for each component: • where viis the volume content of the i-component. Using known relations [8] • where is the wavelength, ’ - i” is the complex dielectric permittivity. It follows for a 3-component mixture of material, water and air, that • W is the moisture content, is the density of the hydrated material, e’W - i e’W is the complex dielectric permittivity of the water of hydration, d is the bulk density of the dry material, e’ is the real part of the relative permittivity of the dry material with density d. Substitution of theseexpressionsinto (1) and (2) leads to expressions (3) and (4) , which associate the measured parameters of the resonator with the moisture and density of the material under test. • (3) • (4) • It should be mentioned, however, that these relationships are valid only for the single phase water i.e. for water which is present in the material in some definite form (either free or bound) and does not change its dielectric properties with variation of moisture. In the majority of cases, and especially in case of low moisture content, this assumption is not valid and therefore, at given frequency, one must use averaged values of permittivity for calculations through the entire range of moisture. • 2.2 The elevated temperature of the fluid-bed - The solution to the second problem is to position the microwave generator and detector away from the high temperature zone. The standard way to do this is to use some special microwave cable to connect between the generator and detector. However, in the case of fluid-bed drying, this approach cannot be considered, since considerable variations in sample density necessarily lead to the loss of the impedance match between the sensor, cable and generator or detector. The alternative approach is simply to increase the length of resonator. Fortheopen/4 resonator of length L (Fig.1) the frequency of principle resonance mode, fr, is given by • (5) • where c is the speed of light in vacuum; C0 is the fringe capacitance of the central conductor; and Zo is the characteristic impedance of the coaxial line. Resonance frequencies associated with higher order modes can be expressed as follows • (6) • where n = 1, 2, … Figure 1. Standard open resonator configuration - D f f f 1 ( ) ( ) o ¢ = » - e - × F V , V 1 S o f f 2 o o 1 1 ( ) ¢ ¢ - » e × F V , V S o Q Q o æ ö U ç ÷ = + - A ln k ( f f ) ç ÷ o U è ø o æ ö U ç ÷ ln ç ÷ U è ø o = k ( ) - f f o 4. RESULTSand DISCUSSION Example results of the calibration tests are shown in Fig. 4. The agreement between the reference measurements and the meter readings (i.e. the accuracy of the sensor) can be described in terms of the standard deviation and the correlation coefficient for the line of best fit. These values are summarised in Table 1 for the different materials investigated. Table 1. Sensor performance characteristics as a function of material type Precise correction for fluctuations in material density was demonstrated (the density was altered by a factor of two) which enabled the authors to suppose that the density variations in the real industrial processes will not affect the accuracy of moisture determination. Furthermore, no substantial restriction for decreasing the range of moisture measurement has been found so far. In particular, the results obtained for talc suggest that it is possible to measure moisture to as low as 0.1% with an accuracy quite sufficient for process control. 5. CONCLUSION The new variant of the two-parameter method was shown to provide adequate metrology for the control of fluid-bed drying, with a measurement accuracy of ~0,14% (typically) to as low as 0.01% (for very low moisture content materials). This approach could also be used in other applications in which a gravity-fed material is free flowing, e.g. in tubes, chutes, air guides, and pneumatic transportation systems. a = a å v , i i i b = b å v i i i p e " a = Figure 2. Extended open resonator configuration l e ' e " w e = r e " W ' e ' Figure 3. w r e = r e - + e - - + ' W ( ' ) ( ' ) ( W ) 1 1 1 1 w d r d 2 æ ö D r f 1 ( ) ç ÷ - » - r e - + e - - × W ( ' ) ( ' ) ( W ) F V , V 1 1 1 ç ÷ w d S 0 r f 2 è ø d 0 æ ö e r " 1 1 ( ) w ç ÷ - » r r e - + e - - × W W ( ' ) ( ' ) ( W ) F V , V 1 1 1 ç ÷ w d S 0 e r Q Q ' è ø w d 0 Figure 3. Extended open resonator configuration with sample cuvette 6. REFERENCES [1] Hlinak, A.J., Saleki-Gerhardt, A. (2000). An evaluation of fluid bed drying of aqueous granulations. Pharm. Dev. Technol. 5: 1-17. [2] Morris K.R., Stowell, J.G., Byrn, S.R., Placette, A.W., Davis, T.D., and Peck G.E. (2000). Accelerated fluid bed drying using NIR monitoring and phenomenological modelling. Drug Dev. Ind. Pharm. 26: 985-988 [3] Kent, M., and Meyer, W. A. (1982) Density-independent microwave moisture meter for heterogeneous foodstuffs, J Food Eng. 1: 31–42. [4] Doelling, M.K., Jones, D,M,, Smith, R,A., and Nash, R,A, (1992). The development of a microwave fluid-bed processor .1. Construction and qualification of a prototype laboratory unit. Pharm. Res. 9: 1487-1492 [5] Doelling, M.K. and Nash, R.A. (1992). The development of a microwave fluid-bed processor .2. Drying performance and physical characteristics of typical pharmaceutical granulations. Pharm. Res. 9: 1493-1501 [6] Kraszewski, A. (1991). Microwave Aquametry - Needs and Perspectives. IEEE Trans. MTT. 39: 828-835. [7] Knochel, R. Technology and Signal Processing of Dielectrometric Microwave Sensors for Industrial Applications, in “Sensors Update”, Volume 7, Edited by H. Baltes, W. Göbel, J. Hesse, Wiley-VCH, Weinheim, Germany, 1999, pp. 65-105 [8] Kent, M. Simultaneous determination of composition and other material properties using microwave sensors, in “Sensors Update”, Volume 7, Edited by H. Baltes, W. Göbel, J. Hesse, Wiley-VCH, Weinheim, Germany, 1999, pp. 3-2 C o = f ( ) r + 4 L c C Z o o Figure 4. The results of the sensor test in the measurement of flour moisture. The standard deviation is 0,13 % and the correlation coefficient is 0,993. ( ) + C n 2 1 o = f ( ) + L cC Z 4 o o