Download
1 / 1
10 likes | 115 Views
Table 3 PTMs of R. palustris ribosomal proteins. Calc. Meas. Mass. error. Cell growth and lysis Sucrose density gradient fractionation. Protein. Modif. ication. a. a. Mass. Mass. (ppm) b. L1. loss of Met. 23877.832. 23877.449. 16.0. L3. plus Methyl. 25622.463. 25622.159.

E N D
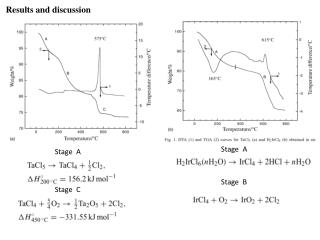
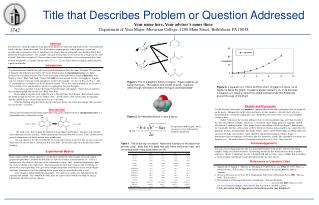
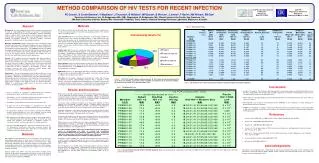
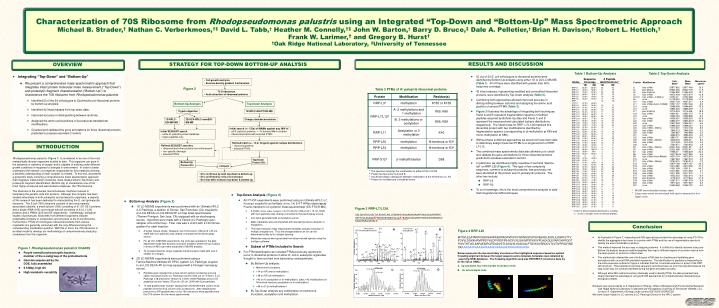
Table 3 PTMs of R. palustris ribosomal proteins Calc. Meas. Mass error • Cell growth and lysis • Sucrose density gradient fractionation Protein Modif ication a a Mass Mass (ppm)b L1 loss of Met 23877.832 23877.449 16.0 L3 plus Methyl 25622.463 25622.159 11.9 Figure 2 L5 plus 2 Methyl 21064.992 21064.576 19.7 • 70 S ribosomes • Acid extraction of ribosomal proteins L6 loss of Met 19272.408 19272.674 - 13.8 L7/L12 loss of Met + 3 Methyl 12754.07 12754.089 - 1.5 L9 none 21178.022 21178.268 - 11.6 L10 loss of Met 19067.739 19067.617 6.4 L11 loss of Met+Acet+ 9 Meth yl 15507.107 15507.246 - 9.0 Bottom-Up Analysis Top-Down Analysis L14 none 13488.498 13488.645 - 10.9 L15 none 16836.243 16836.259 - 1.0 L17 plus 3 Methyl 15716.353 15716.05 6 18.9 Trypsin digestion 1D RPLC-ESI-FTICR-MS L18 loss of Met 12904.93 12905.157 - 17.6 L19 none 14296.764 14296.899 - 9.4 L21 loss of Met 13358.081 13358.533 - 33.8 L22 loss of Met 13826.007 13825.6447 26.2 1D RPLC- ESI-MS-MS 2D SCX-RPLC-nanoESI-MS-MS Charge state deconvolution L23 none 10907.949 10908.021 - 6.6 L24 loss of Met 10998.226 10998.231 - 0.5 L24 loss of Met + Methyl 11012.241 11012.146 8.6 L29 loss of Met 7849.213 7849.239 - 3.3 • Initial search (+/- 5 Da) of MAIMs against avg. MW of • all R. palustris proteins, +/- N-terminal Met truncation • ribosomal proteins with selected PTM’s L30 loss of Met 7092.967 7092.988 - 3.0 • Initial SEQUEST search • entire R. palustris protein database • tryptic peptides only L31 none 8566.315 8566.334 - 2.2 L32 loss of Met 6860.73 6860.636 13.7 L33 loss of Met + Methyl 6248.504 6248.45 8.6 L35 loss of Met 7415.278 7415.278 0.0 L36 none 5063.971 5063.952 3.8 • Refined match (+/- 10 or 30 ppm) against isotopedistributions • ribosomal proteins • selected PTM’s S4 loss of Met + Methyl 23441.536 23441.69 - 6.6 • Refined SEQUEST searches • ribosomal and other proteins from initial search • non-specific cleavage • selected PTM’s S5 loss of Met 20522.086 20522.411 - 15.8 S7 loss of Met 17556.27 17556.629 - 20.4 S8 loss of Met 14477.6316 14477.683 - 3.6 S8 loss of Met+Acet+4 Met h yl 14575.704 14575.619 5.8 A The spectrum localizes the modification to either K155 or K158 B Present as two isoforms A and B. C Insufficient data to distinguish between methylation at the N-terminus vs. K3. D Present in modified and unmodified forms. S10 none 11667.363 11667.404 - 3.5 S11 loss of Met + Methyl 13760.215 13760.314 - 7.2 Top-Down Protein ID’s S12 none 13874.799 13875.167 - 26.5 Bottom-Up Protein ID’s S13 loss of Met 14313.985 14313.596 27.2 compare S14 loss of Met 11331.399 11331.9 - 44.2 S15 loss of Met • ID’s confirmed by both top-down & bottom-up • ID’s confirmed by only one technique • ID’s that differ between top-down & bottom-up * number of different peptide identifications including +1, +2 and +3 charges states for identical peptides Figure 4 RRP-L25 MTSVLELATARPKSGKGAARAERRAGRVPGVIYGDNQSPLPISVEEKELRLRLILAGRFLTTV FDVVLDGKKHRVIPRDYHLDPVRDFPIHVDFLRLGAGATIRVSVVPLHLKGLEVAPGVKRGGT FNIVTHTVELEAPAENIPQFIEADVSTLDIGVSLHLSDIALPTGVKSVSRDDVTLVTIVPPSGYNE DKAAAGAAPAAAAAPAAAAKAPAAAAKAPAAAAPAAKKK Below represents the two most likely structures of the highlighted sequence based on optimal threading alignment between the target sequence and a template (templates were obtained by searching NCBI database). The threading algorithm used was PROSPECT (structures done by Dr. Bo Yan at ORNL). A. Up and down four helix bundle secondary motif. B. An extend alpha helix. A B Characterization of 70S Ribosome from Rhodopseudomonas palustris using an Integrated “Top-Down and “Bottom-Up” Mass Spectrometric ApproachMichael B. Strader,† Nathan C. Verberkmoes,†‡ David L. Tabb,† Heather M. Connelly,†‡ John W. Barton,† Barry D. Bruce,‡ Dale A. Pelletier,†Brian H. Davison,† Robert L. Hettich,†Frank W. Larimer,† and Gregory B. Hurst††Oak Ridge National Laboratory, ‡University of Tennessee RESULTS AND DISCUSSION STRATEGY FOR TOP-DOWN BOTTOM-UP ANALYSIS OVERVIEW Table 1 Bottom-Up Analysis Table 2 Top-Down Analysis • Integrating “Top-Down” and “Bottom-Up” • We present a comprehensive mass spectrometric approach that integrates intact protein molecular mass measurement (“Top-Down”) and proteolytic fragment characterization (“Bottom-Up”) to characterize the 70S ribosome from Rhodopseudomonas palustris. • Identified 53 of the 54 orthologues to Escherichia coli ribosomal proteins by bottom up analysis. • Identified 42 intact masses from top downdata. • Improved accuracy in distinguishing between isoforms. • Assigned the amino acid positions of several post-translational modifications. • Checked and validated the gene annotations for three ribosomal proteins predicted to possess extended C-termini. • 53 out of 54 E. coli orthologues to ribosomal proteins were identified by Bottom-Up analysis using either 1D or 2D LC MS/MS (Table 1). 40 of these were identified with greater than 60% sequence coverage. • 42 intact masses, representing modified and unmodified ribosomal proteins, were identified by Top-Down analysis (Table 2). • Combining both approaches allowed improved accuracy in distinguishing between isoforms and assigning the amino acid position of several PTMS (Table 3). • Figure 3 illustrates the advantage of integrating both techniques. Panel A and B represent fragmentation spectra of modified peptides acquired by Bottom-Up data and Panel C and D represent the measured and calculated isotopic distributions respectively. The intact mass for RRP- L7/L12A matched this ribosomal protein with two modifications identified by fragmentation spectra (corresponding to di-methylation at K69 and mono-methylation at K86). • Without these combined approaches we would not have been able to definitively assign these two PTMs to a single isoform of RRP-L7/L12. • The combined mass spectrometry data also allowed us to check and validate the gene annotations for three ribosomal proteins predicted to possess extended C-termini. • In particular, we identified a highly repetitive C-terminal “alanine tail” on RRP-L25 (Figure 4). This type of low complexity sequence, common to eukaryotic proteins, has previously not been identified at the protein level in prokaryotic proteins. The other two include: • RRP-L9 • RRP-S2 • To our knowledge, this is the most comprehensive analysis to date that integrates two MS techniques. INTRODUCTION Rhodopseudomonas palustris (Figure 1) is considered to be one of the most metabolically diverse organisms studied to date. This organism can grow in the presence or absence of oxygen and is capable of existing under different growth conditions in response to changes in environment. In order to better understand the network of complexes responsible for this metabolic diversity, a detailed understanding of each complex is needed. To this end, we present a proteomic study involving a comprehensive mass spectrometric approach that integrates intact protein molecular mass measurement (Top-Down) and proteolytic fragment identification (Bottom-Up) to characterize one of the most highly conserved and well studied complexes, the 70S ribosome. The ribosome is the universal macromolecular machine involved in translating the genetic code into proteins. Although this complex has been studied extensively in both eukaryotic and prokaryotic organisms, a majority of this research has been dedicated to characterizing the E. coli (prokaryotic) ribosome. The E.coli (70S) ribosome consists of two noncovalently associated subunits; a small subunit (30S) consisting of 21 (S1-S21) proteins and a single rRNA (16S) and a large subunit consisting of 33 (L1-L36) proteins and 2 rRNAs (23S and 5S respectively). Interestingly, biological studies of prokaryotic ribosomes from different organisms indicate remarkable similarity in composition and structure to the E.coli ribosome. Furthermore, PTMs of homologous ribosomal proteins from various organisms are generally conserved with the only difference being the corresponding modification position. With this in mind, the 70S ribosome is an ideal model to develop our methodology of comprehensively analyzing complexes from this organism. 10010.5 63 10010.562 0.1 S16 loss of Met 12017.595 12017.575 1.7 S17 loss of Met 9553.253 9553.316 - 6.6 S18 plus 6 Methyl 9178.219 9177.834 41.9 S19 loss of Met 10087.371 10087.379 - 0.8 S20 loss of Met 9577.324 9577.387 - 6.6 S21 none 10062.669 10062.722 - 5.3 a MAIM (most abundant isotopic mass) b Larger mass errors are associated with species measured at low-signal: noise • Top-Down Analysis (Figure 2) • All FT-ICR experiments were performed using an Ultimate HPLC (LC Packings) coupled to an IonSpec (Irvine, CA) 9.4-T HiRes electrospray Fourier transform ion cyclotron mass spectrometer (ES-FTICR-MS). • A Vydac (Grace-Vydac, Hesperia, CA) C4 column (300m id x 15 cm, 300Å with 5m particles) was directly connected to the electrospray source. • Ions were generated with an Analytica source. • Mass calibration was accomplished with standard proteins (ubiquitin or myoglobin). • The high resolution mass measurement enables isotopic resolution of multiply charged ions. Thus the charged state of an ion can be determined solely by its isotopic spacing. • Molecular masses were generated from deconvoluted spectra using the IonSpec software. • Subset of PTMs included in Search • For PTM identification we included PTMs previously reported to occur in ribosomal proteins of either E. coli or eukaryotic organelles thought to have evolved from bacteria by endosymbiosis. • By Bottom-Up analysis: • Methionine truncations • +14 on KR (mono-methylation) • +28 on KR (di-methylation) • +42 on K (acetylation or tri-methylation), static +42 modifications on N-terminal residues (acetylation or tri-methylation). • +46 on D (-methylthiolation) • By Top-Down analysis any combination of methionine truncation, acetylation and methylation. • Bottom-up Analysis (Figure 2) • 1D LC-MS/MS experiments were performed with an Ultimate HPLC (LC Packings, a division of Dionex, San Francisco, CA) coupled to an LCQ-DECA or LCQ-DECA XP ion trap mass spectrometer (Thermo Finnigan, San Jose, CA) equipped with an electrospray source. Injections were made with a Famos (LC Packings) auto-sampler onto a 50ul loop. Flow rate was 4 ul/min with a 160 minute gradient for each injection. • A Vydac (Grace-Vydac, Hesperia, CA) C18 column (300m id x 25 cm, 300Å with 5m particles) was directly connected to the electrospray source. • For all 1D LC/MS/MS experiments, the LCQ was operated in the data dependent mode with dynamic exclusion enabled, where the top 4 peaks in every full MS scan were subjected to MS/MS analysis. • To increase dynamic range, separate injections were made with over 3 smaller m/z ranges. • 2D LC-MS/MS experiments were performed using a Famos/Swichos/Ultimate 2D HPLC system (LC Packings) coupled to an LCQ-DECA-XP ion trap equipped with a Finnigan nanospray source. • Peptides were injected into a dual column system containing a strong cation exchange (SCX) (LC Packings) column (500 m id x 15mm), a LC Packings C18 precolumn (300m id x 5mm, 300Å PepMap) and a C18 analyticalcolumn Vydac (75m id x 25 cm, 300Å with 5m particles). • 11 step gradient salt “bumps” ranging from 25mM-2M were used to elute peptides from the SCX column onto a precolumn. After desalting the precolumn a RP gradient was run for 160 minutes to elute peptides from the C18 column into the mass spectrometer. Figure 3 RRP-L7/L12A ADLQKIVDDLSSLTVLEAAELAKLLEEKWGVSAAAAVAVAAAPGAGGAAAPAEEK TEFTVVLASAGDK*KIEVIKEVRAITGLGLK*EAKDLVEGAPKPLKEGVNKEEAEKV KAQLEKAGAKVELK Conclusion • As illustrated in Figure 3, integrating both MS approaches provided the advantage of using FT-ICR to identify the aggregate intact mass for a protein with PTMs and the use of fragmentation spectra to identify the exact modification positions. • This method improved the accuracy in assigning isoforms. It is difficult to identify isoforms using only Bottom-Up analysis because modified peptides that map to different regions of a protein may be from the same protein or isoforms of that protein. • This method also allowed the use of both types of MS data for checking and validating gene annotations with unusual DNA predicted sequences. The identification of peptides corresponding to the entire sequence outlined in Figure 4 indicates that this C-terminal extension is a part of the RRP-L25 structure. This predicted C-terminal sequence could have been an error that resulted because the stop codon was not correctly identified during the gene annotation process. • Although either MS method could be individually used to identify PTMs, the data presented here clearly illustrate the advantage of using both MS approaches for comprehensively characterizing a biological complex. • Research was sponsored by U.S. Department of Energy, Office of Biological and Environmental Research. Oak Ridge National Laboratory is operated and managed by University of Tennessee -Battelle, LLC. for the U.S. Department of Energy under contract DE-AC05-00OR22725. • We thank Grace-Vydac for LC columns & LC-Packings-Dionex for the HPLC system • Figure 1 Rhodopseudomonas palustris CGA009 • Purple nonsulfur phototrophic bacteria, member of the α-subgroup of the proteobacteria • Genome sequenced by the DOE, fully assembled • 5.5 Mbp, high GC • High metabolic versatility