Download
1 / 42
420 likes | 653 Views
Geoscience Data Analysis and Visualization Tools from NCAR. HDF/HDF-EOS Workshop XI Nov 6-8, 2007 David Brown. Topics. Two interfaces: the same capabilities (mostly) NCL - a self-contained scripting language PyNGL and PyNIO - Python modules Quick overview: visualization and analysis

E N D
Geoscience Data Analysis and Visualization Tools from NCAR HDF/HDF-EOS Workshop XI Nov 6-8, 2007 David Brown
Topics • Two interfaces: the same capabilities (mostly) • NCL - a self-contained scripting language • PyNGL and PyNIO - Python modules • Quick overview: visualization and analysis • Data model • State of our I/O component development • Enabling access to HDF 5, HDFEOS 5, and NetCDF 4 HDF/HDEOS Workshop XI, November 2007
PyNIO and PyNGL July 2006 (Numeric 24.x/NumPy 1.0) PyNIO 2005 PyNGL 2004 PyHLU 2003 GSUN - Late 90s 2000-present: 30+ NCL Workshops NCL Mid 90s 1995: NCL Conference 1992: NCARG Conference C interface Mid 90s HLUs Mid 90s Original Fortran Late 60s GKS/CGM/Fortran 77/UNIX conversion 1980s NCAR Graphics Brief History NCAR Graphics HLUs NCL NIO PyNGL PyNIO NIO 2005
NCAR Command Language (NCL)A scripting language designed forscientific data analysis and visualization • Simple, robust file input and output • Hundreds of analysis functions • Visualizations (2D) are world class and highly customizable http://www.ncl.ucar.edu/ HDF/HDEOS Workshop XI, November 2007
NCL: Data analysis • Array-based syntax and operators • Hundreds of functions • Spherical harmonics • Scalar and vector regridding • Vertical interpolation • EOFs • Many tailored to geosciences • Most handle missing data • Can call C and Fortran routines HDF/HDEOS Workshop XI, November 2007
NCL: Visualization • High-quality and customizable visualizations • Contours, XY, vectors, streamlines • Maps withmost common map projections • Handles data on regular and irregular grids, triangular meshes • Specialized scripts for skew-T, wind roses, histograms, Taylor diagrams, panels, bar charts • GSUN interface: simplifies visualization • Over 1,400 visualization options available HDF/HDEOS Workshop XI, November 2007
PyNGL - Python module • Python NCL Graphics Library • Python version of popular GSUN interface • Same publication-quality graphics as NCL • Utilizes existing Python modules and development tools (swig, Numeric, NumPy) • Contains some climate-specific data analysis functions • Extensive and updated documentation http://www.pyngl.ucar.edu/ HDF/HDEOS Workshop XI, November 2007
NCL Data Model • Based on netCDF 3 • Language variables can have: • Named dimensions • Attributes • Coordinates variables • A convention in NetCDF but a language feature in NCL • 1d array with the same name as a dimension • Contains coordinate values for dimension elements HDF/HDEOS Workshop XI, November 2007
Supported file format I/O • One function reads all supported data formats: • NetCDF (now including NetCDF4 classic), HDF4, HDF-EOS 2, GRIB 1 and 2 • Writes NetCDF and HDF4 • All file formats massaged into same model: file variables have basically the same features as internal variables • Flat name space: HDF group names are appended to variable names HDF/HDEOS Workshop XI, November 2007
PyNIO - Python module • Same I/O library as NCL (libnio) • Reads and writes same formats as NCL • Same NetCDF-like view of all formats • But interfaces with NumPy for data access • Modeled on the Scientific NetCDF module • NioVariable type is a reference to the variable in the file (metadata is attached to variable) • Dereferencing it results in a NumPy variable with no metadata • *Numpy is a Python array processing module http://www.pyngl.ucar.edu/Nio.shtml HDF/HDEOS Workshop XI, November 2007
2D Coordinates • Traditional NetCDF coordinate variables are 1D vectors • However, satellite data and model data on modern grids require 2D coordinate grids • 2D coordinate variables created on the fly for GRIB grids and HDFEOS Grid-type data • Added value variables that allow data to be plotted on any map projection HDF/HDEOS Workshop XI, November 2007
Enabling NetCDF 4 ‘classic’ • Recompile with NetCDF 4 and HDF 5 1.8 beta (we also included szip) • Add options for specifying format and compression level • Tests using ncl_convert2nc on GRIB files show reduction in file size by ~1/2 over GRIB. • Caveats: • Beta version NetCDF 4 not yet supported on some architectures (64 bit mainly) • Not supported for OPeNDAP NetCDF client library HDF/HDEOS Workshop XI, November 2007
Path to HDF, HDFEOS 5 and full NetCDF 4 support • size_t for dimension sizes to enable large variables on 64-bit hosts • Add support for more atomic types (int64) • Support for groups in the file context • User control of chunking • Compound and variable length data types • Components to read HDF 5 and HDFEOS 5 • Current NetCDF module extended to handle v4 • More support for aggregation HDF/HDEOS Workshop XI, November 2007
Current status • NCL 5.0.0 released this week • NCSA-style Open Source license (finally) • Binaries available under slightly more restrictive license (because of included 3rd party software) • PyNGL/PyNIO 1.2.0 available • Supports NumPy 1.0.x and Python 2.5 • Binaries (easy installation) available for: • Various flavors of Linux, Mac OSX, Cygwin • Other Unix systems, 32 and 64 bit HDF/HDEOS Workshop XI, November 2007
Distribution of NCL sites Distribution of PyNGL/PyNIO sites
Support • Websites with extensive documentation • Tutorials • Hundreds of examples with downloadable scripts • Active email lists • ncl-talk@ucar.edu, pyngl-talk@ucar.edu • Hands-on training workshops HDF/HDEOS Workshop XI, November 2007
Download locations • NCL • PyNGL and PyNIO http://www.ncl.ucar.edu/download.html http://www.pyngl.ucar.edu/download.html HDF/HDEOS Workshop XI, November 2007
Questions? Email me: dbrown@ucar.edu HDF/HDEOS Workshop XI, November 2007
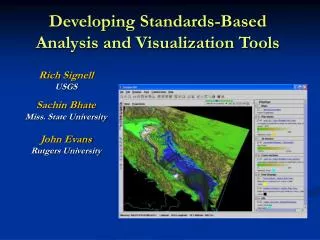
Resources (a.k.a. attributes) • Same control mechanism for NCL and PyNGL • Detailed control of the appearance of a visualization • Example using POP grid ocean current data HDF/HDEOS Workshop XI, November 2007
NCL and PyNGL visualization examples • scatter and line plots, contours, vectors, skew-t, meteograms, maps, wind barbs, bar charts, streamlines, trajectories, filled polygons, paneled visualizations HDF/HDEOS Workshop XI, November 2007
Skew-T graphic Courtesy of Dennis Shea A Skew-T plot is used by meteorologists to analyze data from a balloon sounding.
Based on a visualization of Adam Phillips
Based on a visualization of Joel Norris (Scripps) using dummy data
Data from Climate Analysis Section Christian Guillemot
GRIB 2 TIGGE (THORPEX Interactive Grand Global Ensemble) data Japan Meteorological Agency THORPEX - an international research and development program responding to the weather related challenges of the 21st century to accelerate improvements in the accuracy of 1-day to 2- week high impact weather forecasts for the benefit of society, the economy and the environment.
Courtesy Jeff Yin NCAR CGD
First two map databases built-in; high-resolution available as simple download
This grid could be described as a tripole grid that is further modified by the arbitrary displacement of some portions of the grid to achieve finer resolution over areas of interest (typically, ocean areas). Christophe Cassou (CNRS/CERFACS)
Grid from Tom Gross NOAA/NOS/CSDL/MMAP