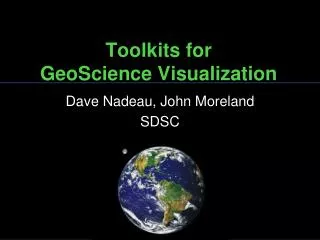
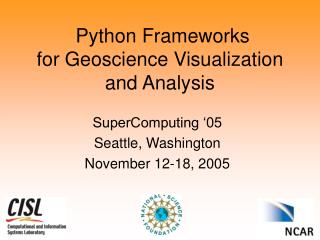
Python Frameworks for Geoscience Visualization and Analysis
Python Frameworks for Geoscience Visualization and Analysis. SuperComputing ‘05 Seattle, Washington November 12-18, 2005. Mary Haley National Center for Atmospheric Research Mesa Lab Boulder, Colorado. Here’s what I’m going to tell you. History lesson What is Python?

Python Frameworks for Geoscience Visualization and Analysis
E N D
Presentation Transcript
Python Frameworksfor Geoscience Visualizationand Analysis SuperComputing ‘05 Seattle, Washington November 12-18, 2005
Mary HaleyNational Center for Atmospheric ResearchMesa Lab Boulder, Colorado
Here’s what I’m going to tell you • History lesson • What is Python? • Why we chose Python • Introduction to PyNGL and PyNIO • Examples • Current status • Future plans SC|05 November 12-18, 2005
History SC|05 November 12-18, 2005
PyNIO 2005 GSUN Late 90s PyNGL 2004 NCL Mid 90s libnio 2005 HLUs Mid 90s PyHLU 2003 C interface Mid 90s GKS/CGM/Fortran 77/UNIX conversion 1980s Original Fortran Late 60s
What is Python? A scripting language often compared with Perl, Tcl, and Java. Shares similarities with NCL.
Why a Python interface? • Demand for high-quality 2D visualization • Capitalize on the work of others • Collaboration opportunities • Mainstream language - wider audience • Contribution to Python community • Open source SC|05 November 12-18, 2005
Python strengths • Open source and portable • Full OO capabilities • Well documented and easy to learn • Callable from Java • Toolkits for building GUIs - Tkinter • 3D visualization - vtk, OpenGL • Extendable with C/C++ and Fortran • Large and rapidly growing user base SC|05 November 12-18, 2005
Python strengthslots of existing code • PyTables - manage large amounts of data, HDF5 • PIL - Python Imaging Library • Libraries of scientific tools • FFTPACK, SPHEREPACK, LAPACK • netCDF module • PyClimate - tools for climate variability analysis. • PyGlobus - toolkit for GRID computing SC|05 November 12-18, 2005
Ray PierrehumbertProfessor at University of ChicagoDept. of Geophysical Sciences “Unlike other simple languages,Python is not something you outgrow.” SC|05 November 12-18, 2005
What is PyNGL? • Python NCL Graphics Library • Python version of popular GSUN interface • Some data processing • Same publication-quality graphics as NCL • Utilizes existing Python modules • Multiple output formats • Extensive documentation http://www.pyngl.ucar.edu/ SC|05 November 12-18, 2005
What is PyNIO? • A multi-format IO module • Modelled after Konrad Hinson’s NetCDF module • A unified NetCDF-like view of all formats • Reads NetCDF, GRIB 1, HDF 4 (SDS), HDFEOS 2 (Grid and Swath), CCM • Writes NetCDF, HDF 4 • Packaged with PyNGL for now, eventually stand-alone SC|05 November 12-18, 2005
filename: ruc2.T00Z.bgrbanl path: /Users/dbrown/grib/ruc2.T00Z.bgrbanl.grb file global attributes: dimensions: gridx_236 = 113 gridy_236 = 151 lv_HYBL2 = 40 lv_DBLL3 = 5 variables: float PRES_236_TRO ( gridx_236, gridy_236 ) center : US National Weather Service - NCEP (WMC) long_name : Pressure units : Pa _FillValue : -999 coordinates : gridlat_236 gridlon_236 level_indicator : 7 grid_number : 236 parameter_number : 1 model : RUC Model from FSL (isentropic; scale: 20km at 40N) forecast_time : 0 initial_time : 05/11/2000 (00:00) … float gridlat_236 ( gridx_236, gridy_236 ) corners : <ARRAY> long_name : latitude GridType : Lambert Conformal Secant or Tangent, Conical or bipolar units : degrees_north … SC|05 November 12-18, 2005
PyNGL and PyNIO examples • Xy, contours, skew-t, meteograms, maps • Interpolation to rectangular grid • Triangular grid • Vector plot of ocean data SC|05 November 12-18, 2005
PyNGL/PyNIO NCL/GSUN import Ngl, Nio # Open the NetCDF file. nf = Nio.open_file("mtemp.cdf","r") # Get lat/lon/temperature variables. lat = nf.variables["lat"][:] lon = nf.variables["lon"][:] T = nf.variables["t"][0,:,:] # Open a PS workstation. wks = Ngl.open_wks("ps","mecca") # Contour & scalar field resources. res = Ngl.Resources() res.sfXArray = lon res.sfYArray = lat res.cnFillOn = True # Draw contour plot. contour = Ngl.contour(wks,T,res) Ngl.end() load "gsn_code.ncl" begin ; Open the NetCDF file. nf = addfile("mtemp.cdf","r") ; Get lat/lon/temperature variables. lat = nf->lat lon = nf->lon T = nf->t(0,:,:) ; Open a PS workstation. wks = gsn_open_wks("ps","mecca") ; Contour & scalar field resources. res = True res@sfXArray = lon res@sfYArray = lat res@cnFillOn = True res@lbPerimOn = False ; Draw contour plot. contour = gsn_contour(wks,T,res) end
Based on a visualization of Joel Norris (Scripps) using dummy data
New types of grids you can contour • Grids already on a triangular mesh • Grids represented by one-dimensional arrays of x, y, and z values • Grids with “cell boundary” information SC|05 November 12-18, 2005
Grid from Brett D. Estrada, Naval Research Laboratory Grid from Brett D. Estrada, Naval Research Laboratory
Interpolation examplesusing natgrid andDelauney triangulation SC|05 November 12-18, 2005
Current status • PyNGL/PyNIO beta 0.1.1b8 available • Binaries (easy installation) available for: • Various flavors of Linux, Mac OSX, • Other Unix systems, 32 and 64 bit • New functions and examples • Extensive documentation • Revamping examples and documentation http://www.pyngl.ucar.edu/download.html SC|05 November 12-18, 2005
Future plans • PyNGL/PyNIO 1.0 by the end of the year • More functions and examples • More IO formats and functionality: • NetCDF 4, GRIB 2, HDF/HDFEOS 5 • Support for groups, structures, etc. • Datasets aggregated from multiple files • Long term - a better display model • Open source (currently distributed as binary) SC|05 November 12-18, 2005
Questions? • PyNGL • http://www.pyngl.ucar.edu • Tutorial, examples with line-by-line descriptions, function reference • PyNIO • http://www.pyngl.ucar.edu/Nio.html SC|05 November 12-18, 2005