Download
1 / 43
430 likes | 623 Views
Impact Evaluation: Data, Tools, Analysis & Visualization Katy Börner Cyberinfrastructure for Network Science Center, Director Information Visualization Laboratory, Director School of Library and Information Science Indiana University, Bloomington, IN katy@indiana.edu

E N D
Impact Evaluation: Data, Tools, Analysis & Visualization Katy Börner Cyberinfrastructure for Network Science Center, Director Information Visualization Laboratory, Director School of Library and Information Science Indiana University, Bloomington, IN katy@indiana.edu With special thanks to the members at the Cyberinfrastructure for Network Science Center, the Sci2 team, and the VIVO Collaboration EERE and ARPA-E Workshop on Measuring and Communicating Program Impacts Washington, D.C. September 14, 2011
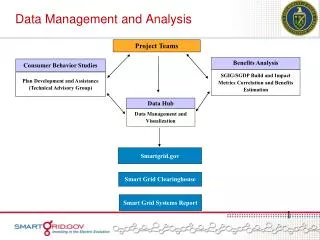
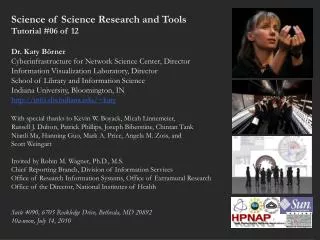
Science of Science Studies: Sci2 Tool 2
While microscopes and telescopes are physical instruments, macroscopes resemble continuously changing bundles of software plug-ins. Sharing algorithm components, tools, or novel interfaces becomes as easy as sharing images on Flickr or videos on YouTube. Assembling custom tools is as quick as compiling your custom music collection. They provide a common standard for the design of modular, compatiblealgorithm and tool plug-ins that can be easily combined into scientific workflows, and packaged as custom tools. Börner, Katy. (2011). Plug-and-Play Macroscopes. Communications of the ACM, 54(3), 60-69. Video is at http://www.scivee.tv/node/27704 Plug-and-Play Macroscopes 3
http://sci2.cns.iu.edu http://sci2.wiki.cns.iu.edu 4
OSGi/CIShell powered tool, see http://cishell.org http://sci2.cns.iu.edu | http://sci2.wiki.cns.iu.edu Börner, Katy, Huang, Weixia (Bonnie), Linnemeier, Micah, Duhon, Russell Jackson, Phillips, Patrick, Ma, Nianli, Zoss, Angela, Guo, Hanning & Price, Mark. (2009). Rete-Netzwerk-Red: Analyzing and Visualizing Scholarly Networks Using the Scholarly Database and the Network Workbench Tool. Proceedings of ISSI 2009: 12th International Conference on Scientometrics and Informetrics, Rio de Janeiro, Brazil, July 14-17 . Vol. 2, pp. 619-630. Sci2 Tool – “Open Code for S&T Assessment”to run replicable workflows Sci Maps GUESS Network Vis Horizontal Timeline 5
Sci2 Tool Geo Maps Circular Hierarchy 7
Network Extraction: Examples Author co-occurrence network Paper-author 2-mode network 8
The Sci2 Tool is used by NSF, NIH, USDA, and private foundations.Upcoming Tutorial: Sci2: A Tool of Science of Science Research and PracticeInstructor: Dr. Katy Börner, Indiana UniversityTime/Date: 8:30a-11:30a on Oct 17, 2011Place: Room II-555 in NSF's Stafford Place II Conference Center, 4121 Wilson Boulevard, Arlington, Virginia 22230, USAAudience: This tutorial is designed for researchers, practitioners, program staff from federal agencies interested to use advanced data mining algorithms and visualizations in their work and daily decision making.Cost: Free. Registration by Oct 10, 2012 required.Register: Please use http://www.surveymonkey.com/s/MVC8LWW to register by Oct 10, 2012. NSF will issue visitor badges. Sci2 Tool Adoption 11
VIVO: A Semantic Approach to Creating a National Network of Researchers (http://vivoweb.org) • Semantic web application and ontology editor originally developed at Cornell U. • Integrates research and scholarship info from systems of record across institution(s). • Facilitates research discovery and cross-disciplinary collaboration. • Simplify reporting tasks, e.g., generate biosketch, department report. Funded by $12 million NIH award. Cornell University: Dean Krafft (Cornell PI), Manolo Bevia, Jim Blake, Nick Cappadona, Brian Caruso, Jon Corson-Rikert, Elly Cramer, Medha Devare, John Fereira, Brian Lowe, Stella Mitchell, Holly Mistlebauer, Anup Sawant, Christopher Westling, Rebecca Younes. University of Florida: Mike Conlon (VIVO and UF PI), Cecilia Botero, Kerry Britt, Erin Brooks, Amy Buhler, Ellie Bushhousen, Chris Case, Valrie Davis, Nita Ferree, Chris Haines, Rae Jesano, Margeaux Johnson, Sara Kreinest, Yang Li, Paula Markes, Sara Russell Gonzalez, Alexander Rockwell, Nancy Schaefer, Michele R. Tennant, George Hack, Chris Barnes, Narayan Raum, Brenda Stevens, Alicia Turner, Stephen Williams. Indiana University: Katy Borner (IU PI), William Barnett,Shanshan Chen, Ying Ding, Russell Duhon, Jon Dunn, Micah Linnemeier, Nianli Ma, Robert McDonald, Barbara Ann O'Leary,Mark Price, Yuyin Sun, Alan Walsh, Brian Wheeler, Angela Zoss.Ponce School of Medicine: Richard Noel (Ponce PI), Ricardo Espada, Damaris Torres.The Scripps Research Institute: Gerald Joyce (Scripps PI), Greg Dunlap, Catherine Dunn, Brant Kelley, Paula King,Angela Murrell, Barbara Noble, Cary Thomas, Michaeleen Trimarchi.Washington University, St. Louis: Rakesh Nagarajan (WUSTL PI), Kristi L. Holmes, Sunita B. Koul, Leslie D. McIntosh.Weill Cornell Medical College: Curtis Cole (Weill PI), Paul Albert, Victor Brodsky, Adam Cheriff, Oscar Cruz, Dan Dickinson, Chris Huang, Itay Klaz, Peter Michelini, Grace Migliorisi, John Ruffing, Jason Specland, Tru Tran, Jesse Turner, Vinay Varughese.
Temporal Analysis (When) Temporal visualizations of the number of papers/funding award at the institution, school, department, and people level 15
Topical Analysis (What) Science map overlays will show where a person, department, or university publishes most in the world of science. (in work) 16
Network Analysis (With Whom?) Who is co-authoring, co-investigating, co-inventing with whom? What teams are most productive in what projects? 17
http://nrn.cns.iu.edu Geospatial Analysis (Where) Where is what science performed by whom? Science is global and needs to be studied globally. 18
VIVO was recently adopted by USDA as a means to federate and serve institutional data; to analyze and communicate funding impact. 19
2008 collaboration patterns for medical institutions located close to Melbourne University Source: Web of Science co authorship information. Compiled by Simon Porter 20
Co-authorship network for the department of Information Systems Source: Melbourne Research Windows. Contact Simon Porter simon.porter@unimelb.edu.au 21
Search term Researcher Bimodal network of search terms and researchers extracted from research profile search results to show the University’s capability in Disaster Management to the Government Contact: simon.porter@unimelb.edu.au 22
P30 Member Collaborations – Sponsored Project Co‐Participation and Co‐Authorship Network. Used in successful! P30 funding application. Shows the PI’s relationships with various P30 members, conveying that the PI was not only the formal center of the group but also the informal center and the person who exhibited the highest betweenness centrality. Contact: Jeffrey Horon, J.Horon@elsevier.com 23
Exploring and Monitoring S&T Landscapes: Online Interactive Maps 24
The dataset covers 13,528 records on "biomass" and "biofuel" research and technology from seven different publication, patent, funding datasets. http://mapsustain.cns.iu.edu 25
Search result for “corn” Icons have same size but represent different #records 28
Click on one icon to display all records of one type. Here publications in the state of Florida. 29
Detailed information on demand via original source site for exploration and study. 30
The science map at 13 top-level scientific disciplineslevel. 31
Showcasing Impact to a Large and Diverse Audience: Large-Format Visualizations 35
Mapping Science Exhibit – 10 Iterations in 10 yearshttp://scimaps.org Mapping Science Exhibit at MEDIA X, Wallenberg Hall, Stanford University http://mediax.stanford.edu, http://scaleindependentthought.typepad.com/photos/scimaps 36
Bollen, Johan, Herbert Van de Sompel, Aric Hagberg, Luis M.A. Bettencourt, Ryan Chute, Marko A. Rodriquez, Lyudmila Balakireva. 2008. A Clickstream Map of Science. 37
Council for Chemical Research. 2009. Chemical R&D Powers the U.S. Innovation Engine. Washington, DC. Courtesy of the Council for Chemical Research. 38
Science Maps in “Expedition Zukunft” science train visiting 62 cities in 7 months, 12 coaches, 300 m long. http://www.expedition-zukunft.de 39
"The Product Space" by Cesar A. Hildalgo, Bailey Klinger, Albert-László Barabási, and Ricardo Hausmann on prominent, interactive display at the MIT Media Lab. See also http://scimaps.org/maps/map/the_product_space_5 40
References Börner, Katy, Chen, Chaomei, and Boyack, Kevin. (2003). Visualizing Knowledge Domains. In Blaise Cronin (Ed.), ARIST, Medford, NJ: Information Today, Volume 37, Chapter 5, pp. 179-255. http://ivl.slis.indiana.edu/km/pub/2003-borner-arist.pdf Shiffrin, Richard M. and Börner, Katy (Eds.) (2004). Mapping Knowledge Domains. Proceedings of the National Academy of Sciences of the United States of America, 101(Suppl_1). http://www.pnas.org/content/vol101/suppl_1/ Börner, Katy, Sanyal, Soma and Vespignani, Alessandro (2007). Network Science. In Blaise Cronin (Ed.), ARIST, Information Today, Inc., Volume 41, Chapter 12, pp. 537-607. http://ivl.slis.indiana.edu/km/pub/2007-borner-arist.pdf Börner, Katy (2010) Atlas of Science. MIT Press. http://scimaps.org/atlas Scharnhorst, Andrea, Börner, Katy, van den Besselaar, Peter (2011) Models of Science Dynamics. Springer Verlag. 42
All papers, maps, tools, talks, press are linked from http://cns.iu.edu CNS Facebook: http://www.facebook.com/cnscenter Mapping Science Exhibit Facebook: http://www.facebook.com/mappingscience 43