Download
1 / 26
260 likes | 383 Views
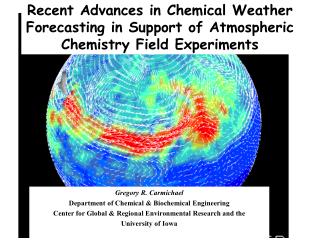
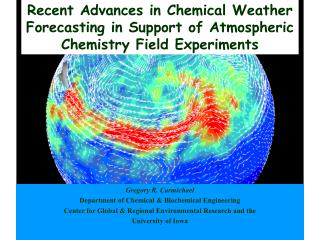
Climatic Effects & Air Quality: Aerosol/Chemistry Interactions and the Role of Megacities. Gregory R. Carmichael. Center for Global and Regional Environmental Research, The University of Iowa, Iowa City, USA. Aerosols are Pervasive Throughout Asian Environments. BC from Pollution & Fires.

E N D
Climatic Effects & Air Quality: Aerosol/Chemistry Interactions and the Role of Megacities Gregory R. Carmichael Center for Global and Regional Environmental Research, The University of Iowa, Iowa City, USA
Aerosols are Pervasive Throughout Asian Environments BC from Pollution & Fires Mineral Dust
A Key Science Issue: Chemistry/Aerosol/Regional Climate Coupling Cirrus Stratus Radiative Forcing Anthropogenic Biogenic Tropospheric O3 Stratospheric input Gas-phase Tropospheric Chemistry Flux of gaseous species to clouds Generation of inorganic and organic aerosols by gas-to-particle conversion and nucleation Heterogeneous NOx/NOy chemistry Free radical Scavenging ? Alteration of Actinic flux Tropospheric Clouds Cloud processing Tropospheric Aerosols CCN NH3 Sea salt Mineral dust Biomass burning particles Sulfates (via gas-phase chemistry) Carbonaceous particles Alteration of cloud albedo (indirect effect) Direct effect Radiative Forcing modified after J.H.Seinfeld 1999
INTERACTIONS OF SO2 WITH MINERAL AEROSOL CHANGE SULFATE SIZE DISTRIBUTION AS WELL AS THE CHEMICAL LIFETIMES OF SULFUR. THESE INTERACTIONS HAVE IMPLICATIONS FOR RADIATIVE FORCING Song et al., JGR in press
Calculated Fine and Coarse Mode Aerosol Distributions in the Boundary Layer; PEM-WEST B
Calculated Fine and Coarse Mode Aerosol Distributions in the Boundary Layer; PEM-WEST B
Calculated Fine and Coarse Mode Aerosol Distributions at 5 km; PEM-WEST B
Calculated Fine and Coarse Mode Aerosol Distributions at 5 km; PEM-WEST B
% Decrease in HO2 levels due to RXNs on Mineral Aerosol (May 1987)
% Change in O3 in May 1987 due to: NOx + HxOy Rxns; Direct O3 Rxn; and Combination
Nitric Acid Reactions with Calcium Carbonate are not Limited to the Surface, and Change the Water Uptake Properties and Particle Morphology Goodman et al., JGR, 105:29053, 2000
STEM on-line TUV overview TUV TOP 80km Overtop O3 = O3 (Dobson) below STEM top height EP/TOMS Total Ozone (Dobson) STEM TOP 15km Ice cloud Output: 30 kinds of J-values for SAPRC99 mechanism Water cloud Inputted from STEM 3-D field Dust Black Carbon Organic Carbon Sulfate Other PM2.5 and Other PM10 absorption by gas-phase species O3, SO2 and NO2 Surface reflection Sea Salt
Impact of Aerosols on the Photochemical Oxidant Cycle Through Photolysis Rates O O 2 3 HO HO 2 NO RO RO 3 2 N O HO 2 2 5 O Emission O 2 NO 3 H O 2 HNO HO 3 CH COO NO HO HO 3 2 2 2 Season Aerosol D D D D TSP Sulfate Soot Mineral CH COO 3 2 % % % % impact on O3 + \ \ \ \ n h n h h n 48.6 58.7 Winter - 18.9 13.2 -8.6 -25.8 -5.8 -33.0 Mean 1.3 + \ \ \ NO 2 Spring - 13.1 24.4 9.7 36.8 -3.7 -11.1 -3.2 -16.8 Mean 1.5 + \ \ \ 25.4 37.6 Summer - 13.7 8.3 -4.0 -12.9 -3.0 -19.1 Mean + \ \ \ \ Fall - 15.5 27.3 9.2 40.3 -20.6 -6.1 -13.5 -3.8 Mean 3 3 Dust Impact on O3 Mineral Optical Depth NOx NMHC O3 HOx UVB % Change %Change NO2 Photolysis Ozone variations (%) due to dust
Urban Environments in Asia • Asia presently has ~1 billion urban dwellers, projected to grow to ~3 billion in 2025 • 10 Asian Megacities will account for ~40% of GNP in 2025 • Each 1 million urban inhabitants emit average of 25,000 tons of CO2 every day (six times global per capita average) • Indoor and Outdoor air pollution pose severe human health concerns • 4%/yr urban growth rate in • Asia-Pacific region • 23 megacities in 1995 (17 in developing countries) to 36 in 2025 (23 in Asia)
Percentage of Sulfur Emissions by Sector & Fuels for year 2000
(b) Figure 2. Comparison of SO2 Emissions from the Megacities of Asia, ktons/year (a) For year 1975, 1980, 1990, 1995 and 2000 (b) For year 2010 and 2020 from RAINS-Asia 7.52
32o Shanghai East China Sea Shanghai Province 30o36’ 120o36’ 122o Integrated Urban AQM • Forward looking policies which anticipate growth in environmental growth and/or retrofitting are most cost-effective. • Policy trajectories include (example): 1995 - distant siting (50 km to 75km); 2000 - ESP, coal washing; 2010 - 2050 - fabric filters and low-NOx burners. • IGCC technology for new power plants and relocation of major industrial estates and power plants to outside the city limits.
China Emissions in 20001 (Tg) Din China’s emissions (2000 – 1995) (Tg) Total global fossil fuel emission ca~1995 (Tg) Change in China’s emissions as % of global total anthropogenic fuel combustion (%) Temp. Response function DT/DEmissions (K/Tg) 2,4 Estimated Change in global temperaturesdue to changes in China’s emissions between 1995 and 2000 (K) 3,4 SO2 20.8 -4.95 134 -3.7% -8.2 10-3 +0.04 BC 0.91 -0.43 5.1 -8.4% 6.5 10-2 -0.026 CO2 3,218 -109 29,700 -0.037% 3.0 10-5 -0.003 CH4 33.4 +1.16 360 +0.32% 7.5 10-4 +0.001 Net change: S = +0.012 Air Pollution and Climate Issues are Intimately Linked
Shanghai Bombay Urban Air Pollution Control Policies and Technical Options Urban Air Quality Manage-ment • Megacities feel the change first. • Health impacts as a primary measure, urban centers will react to policy measures faster than a province or a region. • Important challenge is how to integrate climate and urban air quality in a manner that enables the evaluation of complex policies.