Download
1 / 45
450 likes | 573 Views
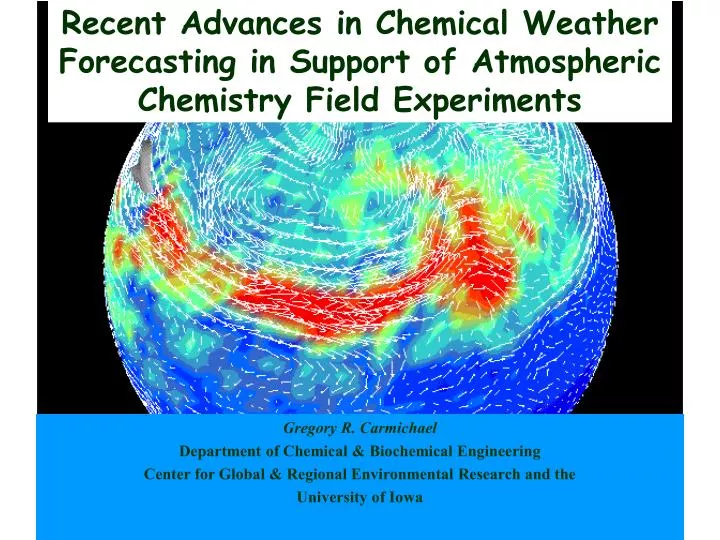
Recent Advances in Chemical Weather Forecasting in Support of Atmospheric Chemistry Field Experiments. Gregory R. Carmichael Department of Chemical & Biochemical Engineering Center for Global & Regional Environmental Research and the University of Iowa. Satellite data in near-real time:

E N D
Recent Advances in Chemical Weather Forecasting in Support of Atmospheric Chemistry Field Experiments Gregory R. Carmichael Department of Chemical & Biochemical Engineering Center for Global & Regional Environmental Research and the University of Iowa
Satellite data in near-real time: MOPITT TOMS SEAWIFS AVHRR LIS TRACE-P EXECUTION Stratospheric intrusions FLIGHT PLANNING Long-range transport from Europe, N. America, Africa ASIAN OUTFLOW 3D chemical model forecasts: - ECHAM - GEOS-CHEM - Iowa/Kyushu - Meso-NH Boundary layer chemical/aerosol processing DC-8 P-3 PACIFIC • Emissions • Fossil fuel • Biomass burning • Biosphere, dust ASIA PACIFIC
Models are an Integral Part of Field Experiments • Flight planning • Provide 4-D context of the observations • Facilitate the integration of the different measurement platforms • Evaluate processes (e.g., role of bomass burning, heterogeneous chemistry….) • Evaluate emission estimates (bottom-up as well as top-down)
CFORS/STEM Model Data Flow Chart Meteorological Outputs from RAMS or MM5 Meteorological Preprocessor Normal meteorological variables: wind velocities, temperature, pressure, water vapor content, cloud water content, rain water content and PV et al Dust and Sea Salt emissions Biomass Emissions Biogenic Emissions CFORS Forecast Model with on-line TUV Emission Preprocessor Post Analysis Large Point Sources Volcanic SO2 Emissions Anthropogenic Area Emissions Satellite Observed total O3 (Dobson Unit)
CFORS/STEM Model Data Flow Chart Meteorological Outputs from RAMS or MM5 Meteorological Preprocessor Normal meteorological variables: wind velocities, temperature, pressure, water vapor content, cloud water content, rain water content and PV et al Dust and Sea Salt emissions Biomass Emissions Tracers/Markers: SO2/Sulfate DMS BC OC Volcanic Megacities CO fossil CO-Biomass Ethane Ethene Sea Salt Radon Lightning NOx Dust 12 size bins Biogenic Emissions CFORS Forecast Model with on-line TUV Emission Preprocessor Post Analysis Large Point Sources Volcanic SO2 Emissions Anthropogenic Area Emissions Satellite Observed total O3 (Dobson Unit)
Frontal outflow of biomass burning plumes E of Hong Kong Biomass burning CO forecast (G.R. Carmichael, U. Iowa) Observed CO (G.W. Sachse, NASA/LaRC) Observed aerosol potassium (R. Weber, Georgia Tech)
% b b Obs M M (w/o bb)
Measured and Modeled Ethane (Blake et al.) as a Function of Latitude DC8 & P3 Flights
Summary of the TRACE-P analysis (A) from SPCvsSPC-OBS-MOD.pdf (S-final) (4) • O3 vs. CCHO • We couldn’t reproduce the high CCHO at low O3 condition. HNO3 vs. SO2 High SO2 and Low HNO3. (Volcano Signal) Also NOy vs. SO2 etc have same feature.
CO under-prediction under 1000m for TRACE-P What doe this tell us ? CO data from Sacshe
Back Trajectories from High CO point. --- CO > 700 --- CO > 600 --- CO > 500 --- CO > 450 --- CO > 400
Back Trajectories from High CO point(Zoom & CO > 500 ppbv) --- CO > 700 --- CO > 600 --- CO > 500
Effect of Model Resolution 80km-resolution forecasted SO2(ppbv) at 1km layer at 3GMT, 04/11/2001 16km-resolution forecasted SO2(ppbv) at 1km layer at 3GMT, 04/11/2001
Characterization of Urban PollutionFlight DC8-13 : 03/21/2001 Flight Path Back Traj. % Urban HCHO • 1000 ppbv of CO, 10 ppbv of HCHO, 100 ppbv of O3 • Fresh plumes out of Shanghai, < 0.5 day in age
We run back-trajectories from each 5 minute leg of merge data set. Keep track of each time a trajectory passes in the grid cell of the city and below 2 km. Classification of trajectory by the Source of Megacity. Age as determined by trajectory is also shown After Before Big difference !!! We catch more number of fresh airmass from Shanghai and Seoul.
Comparing Modeled and Measured Ratios We extract all points associated with a specified city and plot measured ratios and plot modeled ratios.
Comparison of Modeled and Observed Results from China’s Mega Cities
Trace-P Observed - O3 vs NOz DC8 P3
Ratio Analysis by Back trajectory region category. (1) Only from 01-05GMT Japan Central China (Shanghai etc) ΔO3/ΔNOz
NASA-Seawifs The CFORS forecast (upper left) of the two dust systems are shown above. The dust plume (pink) represents the region with dust concentrations greater than 200 mgrams/m3. White indicates clouds. The SeaWifs satellite image (upper right) also clearly shows the accumulation of dust spiraling into the Low Pressure center. Also note the strong outflow of dust in the warm sector “ahead” of the front over the Japan Sea. The two systems are clearly seen in the satellite derived TOMS-AI (aerosol index) (lower right). The dust event is clearly seen in the China SEPA air pollution monitoring network. Lower left hand panel shows extremely large ground level concentrations (http://www.ess.uci.edu/~oliver/tracep/airqual/index.html). The sandstorm and sand-drifting weather, which swept across most parts of China caused severe visibility and air quality problems http://news.xinhuanet.com/english/20010409/395181.htm
TRACE-P Extinction legend Sea Salt PM2.5 Sulfate OC PM10 BC DUST 8 9 10 11 12 13 14 15 16 17 18 Data from Clarke et al.
Simulations for Sensitivity Study • NORMAL: standard STEM simulation. Aerosol and cloud optical properties are explicitly considered • NOAOD: STEM simulation without aerosol optical properties, but with cloud impacts. • CLEARSKY: STEM simulation without aerosol or cloud optical properties. For TRACE-P all DC-8 and P-3 Flights: J[O3 O1D+O2] J[NO2 O3P+NO] Data from Shetter et al.
Cloud and Aerosol Impacts on Photolysis Rates for All TRACE-P Flights Aerosol Impacts = NORMAL – NOAOD Cloud Impacts = NOAOD – CLEARSKY Aerosol Extinction J[NO2] J[O1D]
Cloud and Aerosol Impacts on Chemical Species via Photolysis Rates for All TRACE-P Flights Ethane OH O3 NOx
Observed and calculated O3 on C-130 flight 6 (April11): Red line w/o heterogeneous chemistry; light blue with.
Rishiri DUST[μg/m3] Lev =10,30,60,90,120,150,180,210 10 227 8 8 8 6 6 6 Height[km] Height[km] Height[km] 4 4 4 2 2 2 E90 E120 E150 SO4 [μg/m3] Lev =1,3,6,9,12,15,18,21 1 21.2 0 0 0 Rishiri Tarukawa Sado Harbin Beijing Tsukuba BC[μg/m3] Lev =0.1,0.24,0.36,0.48,0.6,0.72,0.84,0.96,1.08 0.1 1.15 Hachijo N30 Qingdao :BC+OC :DUST OC[μg/m3] 0.1 3.48 Lev =0.1,0.4,0.8,1.2,1.6,2.0,2.4,2.8,3.2 Shanghai :Sea salt 8 Ogasawara 6 Height[km] Nagasaki & Fukue 4 2 :Sulfate 0 Okinawa Fukuoka Amami AOD E.Q. APRIL
IGAC ITCT Y2KExperiment http://www.cgrer.uiowa.edu/people/ytang/itct-2k2.html
Trinidad Head Surface Measurements during ITCT Y2K– Model Forecasts were Provided Daily
Trinidad Head, Ozone, May 3 Ozonesonde May 3, 1850Z MOZART (Larry Horowitz, GFDL) Apr 30 - May 5 (May 3, 19Z = -47)
Where do we go from here?Example of Use of 3-D CFORS modeling system at TRACE-P Information Day in Hong Kong
Goal: Better Integration of Measurements and Model Products • More evolvement of models in the design of the experiments • Data assimilation • What are the most useful forecast products? • More “sophisticated” use of measurements and models – e.g., aerosol issues. • Better coupling between global and regional models • Measurers and modelers need to work even more closely as collaborators • With a goal of developing optimally merged data sets.
U. Iowa/Kyushu/Argonne/GFDL With support from NSF, NASA (ACMAP,GTE), NOAA, DOE
Black Carbon (mg/m3) 6 4 2 0 6 7 8 9 10 11 12 Sulfate (mg/m3) 6 4 2 0 6 7 8 9 10 11 12 Dust (mg/m3) 6 4 2 0 6 7 8 9 10 11 12 Beijing Lidar Measurements and CFORS Model Results
E90 E120 E150 Rishiri Tarukawa Sado Harbin Beijing Tsukuba Hachijo N30 Qingdao Shanghai Ogasawara Nagasaki & Fukue Okinawa Fukuoka Amami E.Q.