Download
1 / 26
260 likes | 393 Views
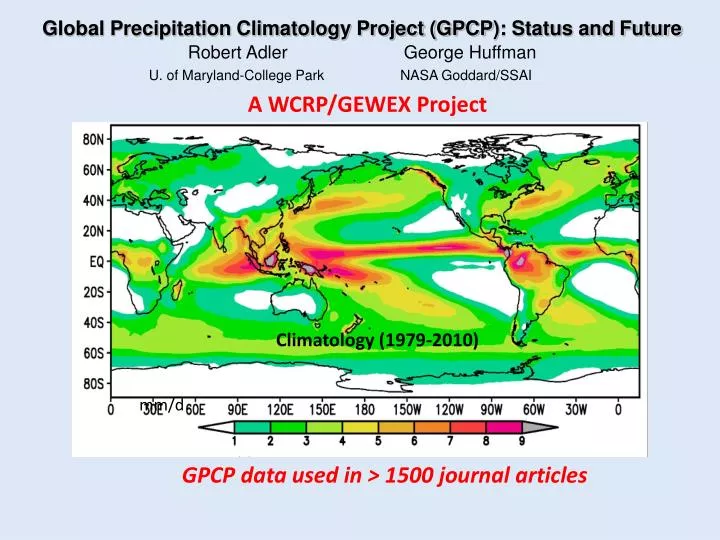
Global Precipitation Climatology Project (GPCP ): Status and Future Robert Adler George Huffman U . of Maryland-College Park NASA Goddard/SSAI. A WCRP/GEWEX Project. Climatology (1979- 2010). mm/ d. GPCP data used in > 1500 journal articles.

E N D
Global Precipitation Climatology Project (GPCP): Status and Future Robert Adler George Huffman U. of Maryland-College Park NASA Goddard/SSAI A WCRP/GEWEX Project Climatology (1979-2010) mm/d GPCP data used in > 1500 journal articles
GPCP Global Precipitation Products NASA, NOAA, DWD, UMD, GMU, others • Monthly, 2.5° Merged Analysis (1979-present) Adler et al. (2003), J. Hydromet; Huffman et al. (2009) GRL [hierarchical adjustment using microwave/geo-IR over ocean and gages/satellite over land plus additional satellite info. for high latitudes and extension back from 1987 to 1979] • Pentad, 2.5° Merged Analysis (1979-present) Xieet al. (2003) J. Climate • Daily, 1° Merged Analysis (1997-present) Huffman et al. (2001) J. Hydromet. [although produced using different data sets and algorithms, products are integrated,i.e. they add up] normally produced ~ 3 months after observation time
GPCP Components/PeopleR. Adler (GPCP Coordinator) • Merge Center--Huffman/Adler, NASA Goddard/U. of Maryland • Gauge Center—Becker, Schneider, German Weather Service, Global Precipitation Climatology Center (GPCC) • Microwave-Land Center--Ferraro, NOAA NESDIS • Microwave-Ocean Center--Chiu, George Mason U. • Pentad/Geosynchronous Center--Xie, NOAA/NWS/CPC
GPCP Monthly (Recently) Extended Through 2010 (new Version 2.2) Compared with Surface Temperature Analysis Surface Temp. Precip. Tropical Global Global Tropical Time series of surface temperature (from GISS), and precipitation averaged overglobal and tropical land+ocean areas Red lines denote the 13-month-running means Global and tropical precipitation trends near zero
Inter-annual (ENSO and Volcano) Global (1988-2008) Surface Temp. (Amplitude ~ .2C) Water Vapor (~ 7%/C for ENSO, ~6%/C for volcano) Precipitation (~ 2%/C for ENSO, ~4%/C for volcano) Trends Surface Temp. (.15 C/10yr) Water Vapor (~ 7%/C, taking into account MERRA trend bias) Precipitation (~ 0%/C) Gu and Adler
Surface Temperature from GISS Trends (1988-2008) °C/decade Water Vapor from SSMI (ocean) mm/decade Precipitation from GPCP mm/d/decade
Linear Changes [Trends] (1979-2008) Mean Precipitation Updated from Adler et al. 2008, JGR
Zonal Trends in Temperature, Water Vapor, and Precipitation over Ocean
Estimating BiasErrors for GPCP Climatology Using Variation among satellite estimates Results for 10 year “Climatology”--entire seasonal cycle σ/mean 2 6 8 Adler et al., 2011 (accepted-JAMC)
Zonal Means (Ocean) σ here is σ of zonal means , not zonal mean of σ’s. σ σ/mean mm/d σ or σ/mean σhigher in mid-latitude for same rain rate; i.e., % bias error larger in mid-latitude (~ 15% at 40º vs. ~10% at 0-15º )
Global (90oS-90oN) mean rain rates (mm day-1) and bias (mm day-1) during 1998-2007 % % % [These error estimates are upper bounds due to regional averaging of errors and inclusion of still questionable input estimates] Adler et al., 2011 (accepted-JAMC)
GPCP Version 3 • New GPCP Version 3 will have: * Monthly--0.5° resolution, GPROF microwave algorithm applied to SSMI, SSMIS data as satellite calibrator (1979-present) * Daily—0.5° resolution (1998-present; possibility of extension back in time). [Pentad for whole 1979-present period] * 3-hr—0.25° (1998-present) to match with ISCCP and SRB products Version 2 Version 3
Summary • GPCP products, widelyused by the community, are generated by a multi-institution, international cadre of scientists (overworked and underfunded) • NOAA is supporting adaptation and transfer of the current GPCP Version 2 production system for continued operational processing at NOAA/NCDC—a classic case of “research to operations” • New Version 3 GPCP development underway withhigher time and space resolutions; part of GEWEX integrated global data set effort; hopefully to start production in2012
High Latitude Precipitation Info. (1997- Present) Validation of GPCP Daily 1°lat. x 2°long. Over Finland February Correlation = .50 August Correlation = .69 Gauge data is off by 6 hrs. from satellite day (00Z-00Z)
Validation of GPCP Daily 1°lat. x 2°long. Over Finland February August February August Value of such data at high latitudes for hydrology (and other) applications (CLIC)? Bolvin, D.T., R.F. Adler, G.J. Huffman, E.J. Nelkin, J.P. Poutiainen, 2009: Comparison of GPCP Monthly and Daily Precipitation Estimates with High-Latitude Gauge Observations. J. Appl. Meteor. Climatol., 48, 1843-1857.
Daily---Example GPCP Version 3 Compared to Version 2.1 Version 3 Mostly microwave 50°N-50°S [1998-present] 0.5° resolution 1 January 2007 Version 2.1 IR adjusted by microwave 40°N-40°S 1.0° resolution Polar regions (>60°) the same in both versions
Example GPCP Version 3 3-hr Product (50N-50S) mm/d January 1, 2007 00 GMT
Example of GPCP Daily Precipitation Analysis—Globally Complete 1998-Present
Trend Maps of Surface Temperature, Ocean Water Vapor and Precipitation through 2010 Surface Temp. Precip. Ocean Water Vapor Linear changes in annual-mean (a, d) surface temperature (K/decade), (b, e) precipitation (mm day-1/decade), and (c) oceanic columnar water vapor (mm/decade).
GPCP Tropical Ocean Precipitation (1979-2008) Original Data-3 month running smoother ENSO and Volcano Signals (Gu et al. 2008 technique) ~ 7% amplitude ~ 3% amplitude Residual after ENSO/volcano effects removed Trend? Nino 3.4 SST anomaly as ENSO index Global stratospheric aerosol as index of volcano
GPCP Tropical Land Precipitation (1979-2008) Original Data-3 month running smoother ENSO and Volcano Signals (Gu et al. 2008 technique) ~ 3% amplitude ~ 7% amplitude Residual after ENSO/volcano effects removed Trend? Nino 3.4 SST anomaly as ENSO index Global stratospheric aerosol as index of volcano
Tropical Land + Ocean Precipitation ~ 3% amplitude ~ 6% amplitude
Tropical Surface Temperature and Precipitation (Land + Ocean) TEMPERATURE ENSO and Volcano Signals TEMPERATURE Trend TEMPERATURE—ENSO larger than volcano, positive trend PRECIPITATION—ENSO muted, smaller than volcano, near zero trend PRECIPITATION ENSO and Volcano Signals PRECIPITATION Trend
Inter-annual Anomalies (25°N-25°S) Of Rain and Surface Temperature for TRMM Era (1998-2006) LAND + OCEAN TRMM PMW GPCP ES/NS 2km 4km TRMM Radar TRMM passive microwave and radar at 4km confirm GPCP ~5%/C relation; TRMM radar (surface to 2 km) does notconfirm P-T relations Wang et al. 2008 (JGR)
Global Surface Temperature and Precipitation (Land + Ocean) TEMPERATURE ENSO and Volcano Signals TEMPERATURE Trend TEMPERATURE—ENSO same amplitude as volcano, positive trend PRECIPITATION—ENSO very muted, smaller than volcano, zero trend PRECIPITATION ENSO and Volcano Signals PRECIPITATION Trend
Linear Changes [Trends] (1979-2008) Surface Temperature from GISS °C/decade Precipitation from GPCP mm/d/decade Updated from Adler et al. 2008, JGR