Download
1 / 11
110 likes | 457 Views
Long Run Cost. Here we study the long run. Long Run Costs.

E N D
Long Run Cost Here we study the long run.
Long Run Costs Remember the long run is when all inputs are variable. I think it is useful to think of the long run as a connection of many short run periods, where each short run period has a different amount of the fixed input. Thus in the long run even the fixed input varies.
Long Run • When we have one unit of capital production follows the process we should in the previous two sections. Now let’s imagine we can have two units of capital. • We would have a similar table of numbers and graphs as we did when only one unit of capital was available.
Long Run continued • When we switch from one unit of capital to two units, we have the long run because all inputs are then variable. • But with the two units we would have short run curves for that level of capital. • Now we have two sets of cost curves, one for one unit of capital and one for two units of capital.
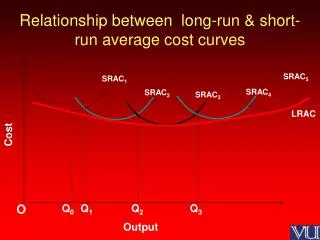
Long run continued • Thus the graph of the long run is really just a bunch of curves, one for each plant size. • I will draw two ATC curves, each with a different amount of capital used.
Long Run Graphs ATC ATC2 ATC1 Q Q1
Interpretation • If output is going to be less than Q1 in the long run then only one unit of capital would be wanted because those units would be produced cheapest with one unit of capital. • Greater than Q1 would be produced cheapest with two units of capital.
Interpretation • The long run curve is made up from parts of the short run curves. For each range of output the long run curve is the segment of the short run curve that is the lowest, representing the cheapest way to produce that range of output in the long run. On the next slide I show the long run curve smoothed out. But from slide 6 you can see it is not probably smoothed.
Smooth long run curve ATC Q
Reason for long run shape • The long run cost curve is said the u - shaped(or maybe L shaped), just as in the short run, but for a different reason. In the short run we had diminishing returns. In the long run we have economies of scale.
Reason continued • The basic idea of economies of scale is that at least for a while when the plant size is increased the average cost curve is pushed down, implying average costs are lowest in a bigger plant. It may be that further increases in plant size push the average cost curve back up. This would technically be called diseconomies of scale.