Download
1 / 39
390 likes | 543 Views
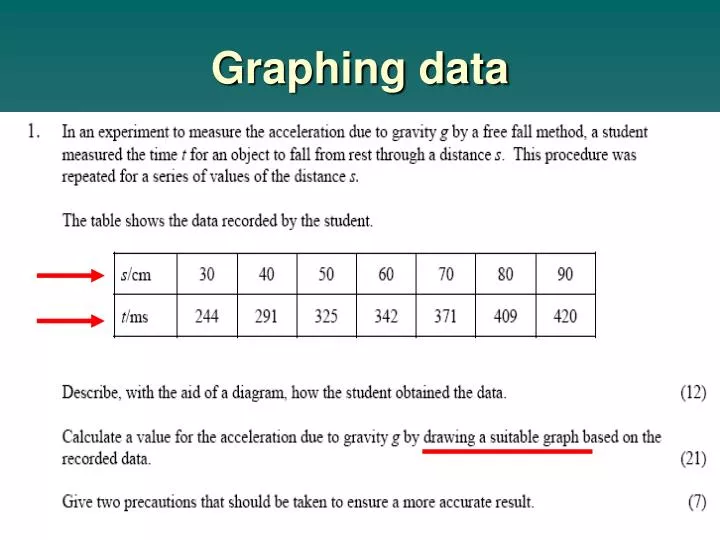
Graphing data. 420 409 371 342 325 291 244. Sometimes students think it is a straightforward matter of graphing one line of data against the other……. t. s. 30 40 50 60 70 80 90. 420 409 371 342 325 291 244. In fact there are several major errors in this graph

E N D
420 409 371 342 325 291 244 Sometimes students think it is a straightforward matter of graphing one line of data against the other……. t s 30 40 50 60 70 80 90
420 409 371 342 325 291 244 • In fact there are several major errors in this graph • How many can you spot? t s 30 40 50 60 70 80 90
420 409 371 342 325 291 244 • Here are some hints….. t s 30 40 50 60 70 80 90
So, it may not be as simple as graphing the exact data that is in the exam question • …………..but there are a number of guidelines to help you
Let’s have another quick look at the relevant wording of the question…
The word “suitable” is important. This is usually a strong hint that the data in the table needs to be manipulated a bit before you graph it • That means that you may have to square the values of one line of data…or maybe halve it or double it etc, before you try to graph it
To decide how to manipulate the data, you must refer back to the formula that is relevant to that experiment • In the example above, the relevant formula is:
Graphing data when a body falls freely under gravityu = 0 and a = g => s = ½gt2 Here, we have the link between ‘s’ and ‘t’ • Note: the ‘t’ is squaredThis means we also need to square the ‘t’ values to ensure we get a straight line graph
Add a new line to the table and square the t values, using your calculator t2/s2 0.0595 0.085 0.106 0.117 0.138 0.167 0.176 Note: the units for ‘t’ are also squared
Now you are ready to draw the graph. There are a few easy things you can do straight away: • Ask for graph paper (no marks otherwise!) • Title the graph • Decide what data will go on each axis • Title the axes (include units)
Graphing data Ask for graph paper (deducted most marks otherwise!) …..seriously!
Graphing data • Title the graphYou can find a very suitable one in the question
Graphing data (iii) Decide what data will go on each axisAs a rule, “their top line is your bottom line” – so ‘s’ will go on the x axis t2/s2 0.0595 0.085 0.106 0.117 0.138 0.167 0.176 Don’t forget to convert to SI units!
To measure g, the acceleration due to gravity, by freefall So far the graph looks like this….….on graph paper…..naturally! s / cm
Graphing data • From the formula, we know we need ‘s’ and ‘t2’, so the middle line of data is not used in the graph. t2/s2 0.0595 0.085 0.106 0.117 0.138 0.167 0.176 The y axis will hold the ‘t2’ values. Also quote the correct units (s2)
To measure g, the acceleration due to gravity, by freefall t2/ s2 ….….on graph paper…..naturally! s /cm
Graphing data • The next stage is VERY IMPORTANTLet’s have another look at the data we now want to plot….start with ‘s’ t2/s2 0.0595 0.085 0.106 0.117 0.138 0.167 0.176
Graphing data • The values go from 30 up to 90….…..but you MUST start at zero • Use as much of your graph sheet as possible……but make sure you go at least as far as 90…ideally up to 100 • You must make equal sized intervals along your x axis
To measure g, the acceleration due to gravity, by freefall t2/ s2 0 0.1 0.2 0.3 0.4 0.5 0.6 0.7 0.8 0.9 1.0 s /cm
t2/s2 0.0595 0.085 0.106 0.117 0.138 0.167 0.176 • Now decide on how your y axis will be divided…. • The values go from approx 0.06 to 0.17…..but you MUST start at zero • You must go AT LEAST AS FAR as 0.176 • Try to use as much of the page as possible, using EQUAL sized divisions • Do NOT write the above readings on your graph!!!!!!!!!
To measure g, the acceleration due to gravity, by freefall 180000 160000 140000 120000 100000 80000 60000 40000 20000 0 t2/ s2 Now, start plotting your points Identify a point by placing a dot exactly at the point, and draw a small circle around it to highlight it 0 0.1 0.2 0.3 0.4 0.5 0.6 0.7 0.8 0.9 1.0 s /m
You must NEVER…..join-the-dots! • Always pick a “best-fit” line. If the dots don’t form an EXACT straight line, make sure there is the same number of dots on each side of the line.
To measure g, the acceleration due to gravity, by freefall 180000 160000 140000 120000 100000 80000 60000 40000 20000 t2/ ms2 0 0.1 0.2 0.3 0.4 0.5 0.6 0.7 0.8 0.9 1.0 s /m
To measure g, the acceleration due to gravity, by freefall 0.18 0.16 0.14 0.12 0.10 0.08 0.06 0.04 0.02 t2/ s2 0 0.1 0.2 0.3 0.4 0.5 0.6 0.7 0.8 0.9 1.0 s /cm
To read a slope from the graph, take two points ON THE LINE, (not from the table) that are far apart • Usually we can use the origin as one of these points • Then use the formula: slope =
To measure g, the acceleration due to gravity, by freefall 0.18 0.16 0.14 0.12 0.10 0.08 0.06 0.04 0.02 t2/ s2 (90, 0.176 (0,0) 0 0.1 0.2 0.3 0.4 0.5 0.6 0.7 0.8 0.9 1.0 s /m
From the graph the units are: From the formula
Other “suitable” graphs • A number of other data experiments will require you to plot a “suitable” graph • Make sure to consider carefully what you will plot • Study the next few examples and decide what should be plotted on y and x axes. Also determine how to get slope • Study how many graphs are straight lines
“Suitable graphs 1” ANS: P against 1/V P 1/V Boyles Law:You will be supplied with P and V measurements. What will you plot against what?
“Suitable graphs 2” ANS: l against T2 Slope = y/x = l/T2 = g/4∏ l T2 Measure g, using pendulumYou will be supplied with l and T measurements. What will you plot against what? What is slope?
“Suitable graphs 3” ANS: f against 1/ lSlope = y/x = f/(1/l) = ½√(T/µ) f 1/ l Measure fundamental freq. against lengthYou will be supplied with f and l measurements What will you plot against what? What is slope?
“Suitable graphs 4” ANS: f against √TSlope = y/x = f/√T = 1/(2L√µ) f √T Measure fundamental freq. against TensionYou will be supplied with f and T measurements. What will you plot against what? What is slope?
“Suitable graphs 5” ANS: 1/v against 1/uTo get f: Rather than use slope, take any point on line (1/u,1/v) = (x,y), then 1/f = 1/u + 1/v = x+y 1/v (1/u, 1/v) 1/u Measure f of concave mirror or converging lensYou will be supplied with u and v measurements. What will you plot against what?
“Suitable graphs 6” ANS: Sin i against Sin r (or real against apparent) Slope = y/x = Sin i/Sin r = n = refractive index Sin i Sin r Verify Snell’s LawYou will be supplied with <i and <r measurements.(or possibly Real depth and Apparent depth) What will you plot against what? What is slope?
“Suitable graphs 7” ANS: ∆θ against I2Slope: y/x = ∆θ/I2 = Rt/mc ∆θ I2 Joules Law:You will be supplied with ∆θ and I measurements What will you plot against what? What is slope?
In summary…. • Use a formula to help you decide what goes where (Their top line is your bottom line) • Do it on graph paper • Title the graph and the axes Include units on the axes • Divide your axes correctly • Plot your points • Use slope formula to get required information • And finally………..
If you make a mistake on your division of axes etc, it is often quicker and neater to start again • ….Ask for more graph paper