Download

1 / 9

E N D
4.5 Graphing Data Objectives: Interpret line graphs, bar graphs, and circle graphs. Represent data with circle graphs. Analyze graphs in order to find a misleading presentation of data.Standards Addressed: 2.7.8.B: Present the results of an experiment using visual representations. 2.8.8.G: Represent relationships with tables or graphs in the coordinate plane.
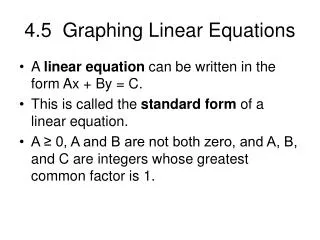
Bar graphs use rectangular bars or objects to represent data. • A line graph is a type of graph that uses line segments between known data points to show changes that have occurred over time. • In a circle graph, or pie chart, data are represented as parts of a circle.
Ex. 1b. Find the approximate value of Don’s MRI stock in 1997 and of Don’s CBC stock in 1999. Construct a bar graph that shows the approximate value of Don’s CBC stock from 1995 to 1999. • MRI 1997 $340 • CBC 1999 $160
b. Find how much money, on average, a family with an annual income of $32,000 spends on investments, clothing, and miscellaneous expenses. • Investment .08 * 32,000 = 2560 • Clothing .06 * 32,000 = 1920 • Miscellaneous .22 * 32,000 = 7040
Ex. 3a. Use the information in the table to make a circle graph for the # of cats in each breed that are entered in the Feline Fanciers cat show. Persian 29% Abyssinian 9% Balinese 19% Manx 12% Siamese 31%
Ex. 3b. Use the information in the table below to make a circle graph for the number of dogs in each breed that are entered in a dog show. • Golden Retriever 25% • Doberman Pinscher 40% • Great Dane 6% • German Shepherd 17% • Irish Setter 12%