Download
1 / 1
10 likes | 116 Views
Atrial Electrogram Complexity as a Clinical Instrument for Measuring Temporal Fractionation Variability during Atrial Fibrillation Tiago P Almeida 1 , João L Salinet Jr 1 , Gavin S Chu 2 , G André Ng 2 , Fernando S Schlindwein 1

E N D
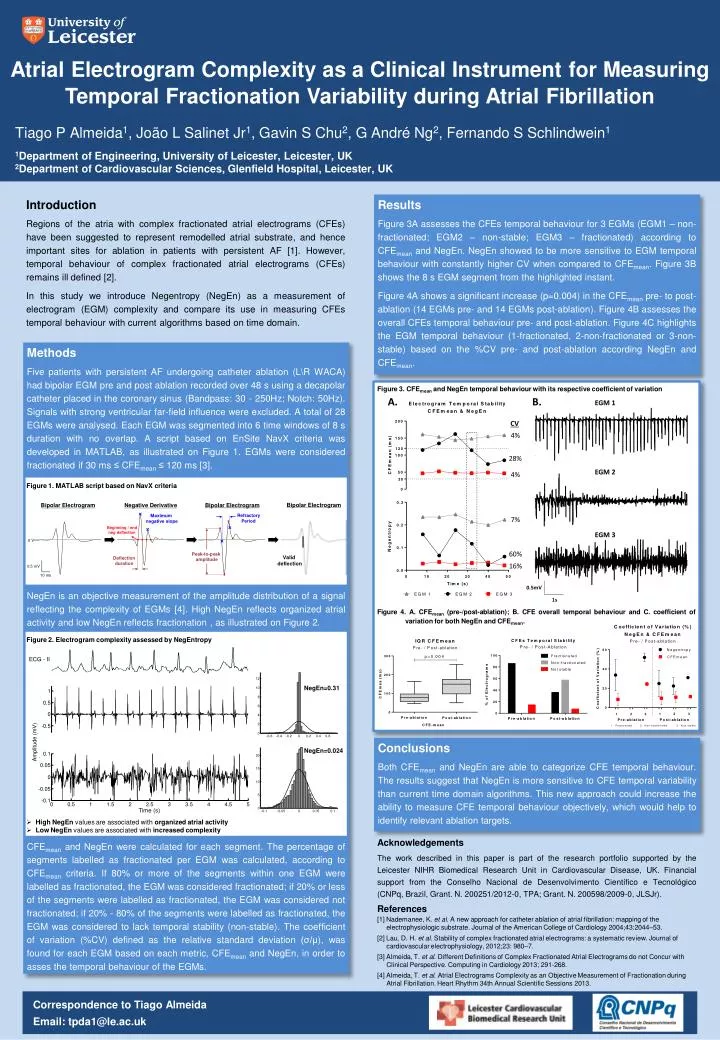
Atrial Electrogram Complexity as a Clinical Instrument for Measuring Temporal Fractionation Variability during Atrial Fibrillation • Tiago P Almeida1, João L Salinet Jr1, Gavin S Chu2, G André Ng2, Fernando S Schlindwein1 • 1Department of Engineering, University of Leicester, Leicester, UK • 2Department of Cardiovascular Sciences, Glenfield Hospital, Leicester, UK Introduction Regions of the atria with complex fractionated atrial electrograms (CFEs) have been suggested to represent remodelled atrial substrate, and hence important sites for ablation in patients with persistent AF [1]. However, temporal behaviour of complex fractionated atrial electrograms (CFEs) remains ill defined [2]. In this study we introduce Negentropy(NegEn) as a measurement of electrogram (EGM) complexity and compare its use in measuring CFEs temporal behaviour with current algorithms based on time domain. • Results • Figure 3A assesses the CFEs temporal behaviour for 3 EGMs (EGM1 – non-fractionated; EGM2 – non-stable; EGM3 – fractionated) according to CFEmeanand NegEn. NegEn showed to be more sensitive to EGM temporal behaviour with constantly higher CV when compared to CFEmean. Figure 3B shows the 8 s EGM segment from the highlighted instant. • Figure 4A shows a significant increase (p=0.004) in the CFEmeanpre- to post-ablation (14 EGMs pre- and 14 EGMs post-ablation). Figure 4B assesses the overall CFEs temporal behaviour pre- and post-ablation. Figure 4C highlights the EGM temporal behaviour (1-fractionated, 2-non-fractionated or 3-non-stable) based on the %CV pre- and post-ablation according NegEn and CFEmean. • Methods • Five patients with persistent AF undergoing catheter ablation (L\R WACA) had bipolar EGM pre and post ablation recorded over 48 s using a decapolar catheter placed in the coronary sinus (Bandpass: 30 - 250Hz; Notch: 50Hz). Signals with strong ventricular far-field influence were excluded. A total of 28 EGMs were analysed. Each EGM was segmented into 6 time windows of 8 s duration with no overlap. A script based on EnSite NavX criteria was developed in MATLAB, as illustrated on Figure 1. EGMs were considered fractionated if 30 ms ≤ CFEmean≤ 120 ms [3]. • NegEn is an objective measurement of the amplitude distribution of a signal reflecting the complexity of EGMs [4]. High NegEn reflects organized atrial activity and low NegEn reflects fractionation , as illustrated on Figure 2. • CFEmeanand NegEn were calculated for each segment. The percentage of segments labelled as fractionated per EGM was calculated, according to CFEmeancriteria. If 80% or more of the segments within one EGM were labelled as fractionated, the EGM was considered fractionated; if 20% or less of the segments were labelled as fractionated, the EGM was considered not fractionated; if 20% - 80% of the segments were labelled as fractionated, the EGM was considered to lack temporal stability (non-stable). The coefficient of variation (%CV) defined as the relative standard deviation (σ/μ), was found for each EGM based on each metric, CFEmeanand NegEn, in order to asses the temporal behaviour of the EGMs. Figure 3. CFEmeanand NegEn temporal behaviour with its respective coefficient of variation Figure 1. MATLAB script based on NavX criteria Figure 4. A. CFEmean(pre-/post-ablation); B. CFE overall temporal behaviour and C. coefficient of variation for both NegEn and CFEmean. Figure 2. Electrogram complexity assessed by NegEntropy • Conclusions • Both CFEmeanand NegEn are able to categorize CFE temporal behaviour. The results suggest that NegEn is more sensitive to CFE temporal variability than current time domain algorithms. This new approach could increase the ability to measure CFE temporal behaviour objectively, which would help to identify relevant ablation targets. • High NegEn values are associated with organized atrial activity • Low NegEn values are associated with increased complexity Acknowledgements The work described in this paper is part of the research portfolio supported by the Leicester NIHR Biomedical Research Unit in Cardiovascular Disease, UK. Financial support from the Conselho Nacional de Desenvolvimento Científico e Tecnológico (CNPq, Brazil, Grant. N. 200251/2012-0, TPA; Grant. N. 200598/2009-0, JLSJr). References [1] Nademanee, K. et al. A new approach for catheter ablation of atrial fibrillation: mapping of the electrophysiologicsubstrate. Journal of the American College of Cardiology 2004;43:2044–53. [2] Lau, D. H. et al. Stability of complex fractionated atrial electrograms: a systematic review. Journal of cardiovascular electrophysiology, 2012;23: 980–7. [3] Almeida, T. et al. Different Definitions of Complex Fractionated Atrial Electrograms do not Concur with Clinical Perspective. Computing in Cardiology 2013; 291-268. [4] Almeida, T. et al. Atrial Electrograms Complexity as an Objective Measurement of Fractionation during Atrial Fibrillation. Heart Rhythm 34th Annual Scientific Sessions 2013. • Correspondence to Tiago Almeida • Email: tpda1@le.ac.uk