Download
1 / 16
170 likes | 262 Views
Martin Piringer (ZAMG), Silvio Schüler (BFW). Case studies of pollen spread within a Central European Forest canopy. Bundesforschungs- und Ausbildungszentrum für Wald, Naturgefahren und Landschaft Institut für Genetik. Outline. Site characteristics and topography of the study area

E N D
Martin Piringer (ZAMG), Silvio Schüler (BFW) Case studies of pollen spread within a Central European Forest canopy Bundesforschungs- und Ausbildungszentrum für Wald, Naturgefahren und Landschaft Institut für Genetik
Martin Piringeret al. Outline • Site characteristics and topography of the study area • Pollen sampling and meteorological observations • Meteorological interpretation of the time course of pollen concentrations • Results for three episode days with enhanced pollen production • Summary and conclusions
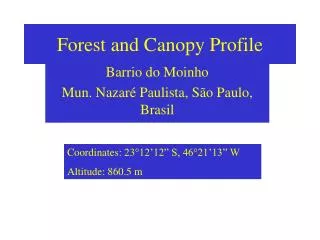
Martin Piringeret al. Site characteristics Topographic details around the lower tower
Martin Piringer et al. Instrumentation on the lower tower
Martin Piringer et al. Meteorological parameters • Ultrasonic anemometers at the three levels of the tower deliver - wind direction and speed - vertical velocity - standard deviations of wind components • From sonic temperature fluctuations: - Obukhov length - friction velocity - sensible heat flux • Analog sensors: air temperature, humidity • Vapour pressure deficit: VPD = esat – ecurr
Martin Piringer et al. Phenological observations • all trees (487) within a radius of ~ 50 m around the tower have been identified, marked, measured and mapped (in progress) • During flowering and flushing – every 2-4 days, all trees were visually surveyed for the status of flowering and flushing To determine exactly which tree flowered at which day
top of the trap chamber drum Martin Piringer et al. Pollen counts • A new vertical pollen collector which allows continuous sampling of pollen from all directions with high temporal resolution has been developed • The spore trap comprises a chamber into which air is drawn through the top of the trap with the aid of a fan. • A small part of air-stream impacts on a slowly rotating drum, which is operated by a clockwork mechanism to revolve once every seven days, every two days or every day. • The drum is covered by a transparent plastic tape, which is coated with vaseline, on which airborne particles are trapped. • The tape is replaced every week and then cut into seven sections and mounted for microscopy.
Martin Piringer et al. Example of pollen transport to the area ECMWF backwards trajectories arriving on 23. 4. 09 at 0:00 UTC (yellow), 3:00 UTC (green) and 6:00 Uhr (red)
Martin Piringer et al. All backwards trajectories 925 hPa, Norway spruce Trees flowering and pollen measured on site Trees not flowering, but pollen measured on site
Martin Piringer et al. Meteorological analysis of measured pollen concentrations (I) VPD = esat – ecurr esat = saturation vapour pressure ecurr = actual vapour pressure
Martin Piringer et al. Meteorological analysis of measured pollen concentrations (II) VPD = esat – ecurr esat = saturation vapour pressure ecurr = actual vapour pressure
Martin Piringer et al. Dispersion of pollen: outline of method • Lagrange particle diffusion model LASAT • Met. Input: Time series of wind direction, wind speed, MOL, standard deviations of the wind components from the upper platform of the tower • Pollen emission rates determined via „inverse dispersion technique“ • Result: Field of pollen concentrations, averaged over the hours of pollen release (assumption: all measured pollen released in situ, no advection)
Martin Piringer et al. Pollen transport: results for oak
Martin Piringer et al. Pollen transport: results for Norway spruce
Martin Piringer et al. Summary and conclusions • Special data set of simultaneous pollen and met. measurements at the same levels of a 36 m high tower • Advection of pollen can be explained by analysis of backwards trajectories • Vertical velocity determines pollen spread within the canopy • VPD influences pollen release; also important: stand. dev. of wind components, wind speed • Modelling pollen transport: most pollen remain within study area due to low wind speeds and good vertical mixing on pollen release days
Martin Piringer et al. Thank you very much for your attention!