Download
1 / 23
350 likes | 1.68k Views
SHARON LAWNER WEINBERG SARAH KNAPP ABRAMOWITZ. Statistics SPSS An Integrative Approach SECOND EDITION. Measures of a Distribution’s Central Tendency, Spread, and Shape. Using. Chapter 3. Overview. Measures of Central Tendency (Level) Mode Median Mean Measures of Dispersion (Spread)

E N D
SHARON LAWNER WEINBERG SARAH KNAPP ABRAMOWITZ Statistics SPSS An Integrative Approach SECOND EDITION Measures of a Distribution’s Central Tendency, Spread, and Shape Using Chapter 3
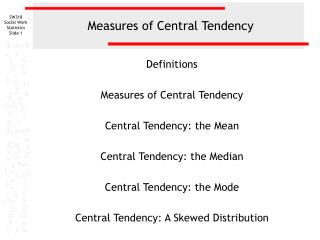
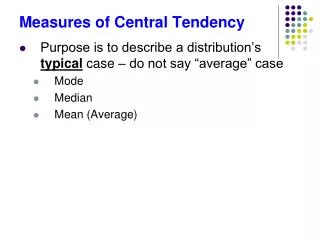
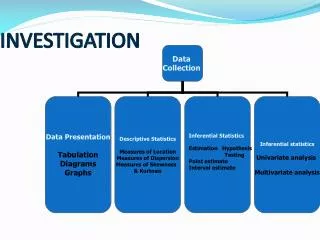
Overview • Measures of Central Tendency (Level) • Mode • Median • Mean • Measures of Dispersion (Spread) • Range • Interquartile Range • Variance • Standard Deviation • Measure of Shape • Skewness and Skewness Ratio
Measures of Central Tendency: Mode Definition: The mode is the score that occurs most often. Useful when data are nominal or ordinal with only a limited number of categories. To find the mode, click Analyze on the main menu bar, Descriptive Statistics, and then Frequencies. Click on Options, and the square next to mode. Click OK.
Measures of Central Tendency: Mode Example: Home Language Background (HOMELANG) What is this variable’s mode? Mode = English Only
Measures of Central Tendency: Mode Example: Although the mode is technically the South, the North Central is close enough that the distribution may be considered bimodal.
Measures of Central Tendency: Mode • Definition: A bimodaldistribution is one with two modes, usually at some distance apart from each other. • Definition: A uniformdistribution is one in which all values occur with the same frequency.
Measures of Central Tendency: Median Definition: The median is the middle point in a distribution. Useful when data are ordinal or scale and severely skewed. To find the median, click Analyze on the main menu bar, Descriptive Statistics, and then Explore. Click OK. Or, to find the median, click Analyze on the main menu bar, Descriptive Statistics, and then Frequencies. Click on Options, and the square next to median. Click OK.
Measures of Central Tendency: Mean Definition: The mean is the sum of all of the data points divided by the number of data points. Useful when data are scale and not severely skewed. To find the mean, click Analyze on the main menu bar, Descriptive Statistics, and then Explore. Click OK. OR use Frequencies OR use Descriptives.
Measures of Central Tendency: Mean In the case where the variable is dichotomous and coded as 0 and 1, the mean is interpreted as the proportion of 1’s in the distribution. • Example: Gender
Measures of Central Tendency:Comparing the Mean, Median, and Mode Compare the values of the mode, median, and mean for SES, EXPINC30, and SCHATTRT.
Measures of Dispersion Visually When traveling to these two cities, would the same clothing be suitable for both cities at any time during the year from the point of view of warmth?
Measures of Dispersion How can we quantify the obvious difference in temperature variability across the year between these two cities? • One Answer: By using the range or interquartile range (IQR). • Another Answer: By using the variance or standard deviation.
The Range and Interquartile Range Definition: The range is the difference between the highest and lowest values in the distribution. The interquartilerange (IQR) is the range of the middle half of the data, or the difference between the 75th and 25th percentiles. Useful when data are ordinal or scale and severely skewed. To find the IQR and range, click Analyze on the main menu bar, Descriptive Statistics, and then Explore. Click OK.
The Variance and Standard Deviation Definition: The variance is the average of the squared deviations from the mean. The standarddeviation is the square root of the variance. We may think of the standard deviation as the distance we have to travel in both directions from the mean to capture the majority of values in a distribution. The farther out we need to travel, the more spread out are the values of the distribution from the mean. Useful when data are scale and not severely skewed. To find the SD and Variance, click Analyze on the main menu bar, Descriptive Statistics, and then Explore. Click OK.
Measures of Dispersion We get the following values for the temperature example. Consistent with the earlier boxplots, for all quantitative measures, Springfield is shown to have a greater temperature spread than San Francisco.
Measures of Dispersion Key words to indicate that a question relates to dispersion: Spread, variability, dispersion, heterogeneity, inconsistency, unpredictability
Measures of Shape Definition: The skewnessstatistic is a measure of the shape of a distribution. It is negative when the distribution is negatively skewed, zero when the distribution is not skewed, and positive when the distribution is positively skewed. Its calculation is based on the cubed deviations from the mean. Definition: The skewnessratio is the value of the skewness statistic divided by its standard error. This measure is useful for determining the extent of skew. As a rule of thumb, when this ratio exceeds 2 in magnitude for small and moderate sized samples, the distribution is considered to be severely skewed. Useful when data are scale. To find the skewness ratio, click Analyze on the main menu bar, Descriptive Statistics, and then Explore. Click OK. Divide the skewness statistic by the standard error of the skew.
How the Shape of the Distribution Affects the Mean and Median • For a severely positively skewed distribution, in general, the mean is greater than the median. • For a severely negatively skewed distribution, in general, the mean is less than the median. • For a symmetric distribution, the mean equals the median.
Which Measure of Central Tendency Should One Use • An article in the Wall Street Journal online (http://online.wsj.com/article/SB118790518546107112.html)from August 24, 2007 reported the following: • The average cost of a wedding is between $27,400 and $28,800. • The median is approximately $15,000. How can we justify this apparent contradiction in the cost of a wedding?
Applying What We have Learned • What is the extent to which eighth-grade males expect larger incomes at age 30 than eighth-grade females? • To what extent is there lack of consensus among males in their income expectations ascompared to females? • How are the answers to these questions influenced by the outliers and general shape of these distributions as shown in the boxplots in the last slide?