Download

1 / 12
170 likes | 748 Views
Demographic Transition Model. Why is population increasing at different rates in different countries?. Stage 1: Low Growth. High CBR and CDR but nearly the same Hunting and gathering Around 8000 BC the world’s population began growing more rapidly Agricultural Revolution

E N D
Why is population increasing at different rates in different countries?
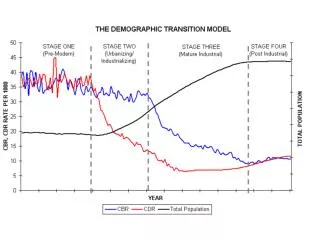
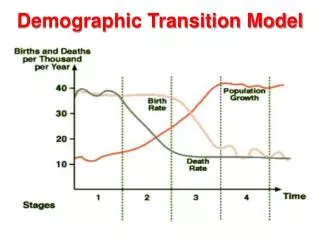
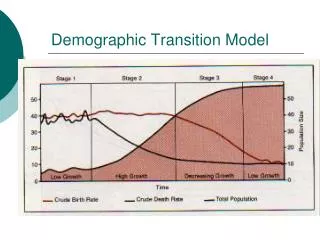
Stage 1: Low Growth • High CBR and CDR but nearly the same • Hunting and gathering • Around 8000 BC the world’s population began growing more rapidly • Agricultural Revolution • Most of human history has been spent at stage 1, but no country remains there today.
Stage 2: High Growth • CDR plummets while CBR remains high • NIR is high • 1750-1800: Industrial Revolution (Europe and US) • 1950s:Medical Revolution (Latin America, Asia and Africa)
Stage 3: Moderate Growth • CBR drops sharply, CDR is still dropping but not as rapidly • Population is still growing but not as rapidly • Europe and North America: 1900-1950 • Asia and Latin America: recently • Most African nations are still in stage 2 • CBR drops because of changes in social customs • People chose to have fewer children • More confident that children will survive to adulthood • Economic changes, more urban
Stage 4: Low Growth • CBR declines to a point that it equals the CDR • zero population growth (ZPG) • Countries in stage 4 can be seen in the TFR map • Social customs can also explain stage 4 • More women in the workforce • Changes in lifestyle: birth control, increased income and leisure time • Negative Population Growth
Demographic Transition in England Fig. 2-14: England was one of the first countries to experience rapid population growth in the mid-eighteenth century, when it entered stage 2 of the demographic transition.
Population Pyramids in U.S. Cities Fig. 2-16: Population pyramids can vary greatly, with different fertility rates (Laredo vs. Honolulu), or among military bases (Unalaska), college towns (Lawrence), and retirement communities (Naples).
Rapid Growth in Cape Verde Fig. 2-17: Cape Verde, which entered stage 2 of the demographic transition in about 1950, is experiencing rapid population growth. Its population history reflects the impacts of famines and out-migration.
Moderate Growth in Chile Fig. 2-18: Chile entered stage 2 of the demographic transition in the 1930s, and it entered stage 3 in the 1960s.
Low Growth in Denmark Fig. 2-19: Denmark has been in stage 4 of the demographic transition since the 1970s, with little population growth since then. Its population pyramid shows increasing numbers of elderly and few children.