Download
1 / 55
550 likes | 682 Views
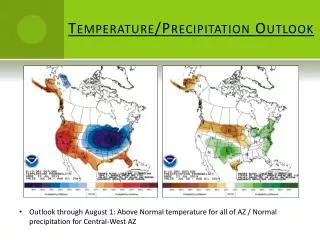
Analysis of observed temperature and precipitation extremes over South Asia Jayashree Revadekar Centre for Climate Change Research Indian Institute of Tropical Meteorology Pashan, PUNE. Indices of extremes are computed to determine Intensity Frequency Spell Duration Seasonal Length

E N D
Analysis of observed temperature and precipitation extremes over South Asia Jayashree Revadekar Centre for Climate Change Research Indian Institute of Tropical Meteorology Pashan, PUNE
Indices of extremes are computed to determine Intensity Frequency Spell Duration Seasonal Length Extreme Range Using daily timeseriestmax,tmin, precip Using climdex
Initial analysis is based on 121 Indian stations for temperature and 146 for precipitation Alexander et al., (2006) in JGR Tank et al., (2006) in JGR
197 South Asian stations As a part of APN project on extremes Pakistan, India, Bagladesh, Nepal, Srilanka Role of altitude & latitude : Revadekar et al., Int J. Climatology (2013) Regional Trends Analysis : Munir Sheikh et al, Int. J. Climatology (2013) under revision
Attempt is also made to see Role of Nino Index on Temperature Extremes (Revadekar et al., 2009, Int. J. Climatology) Change in one extreme leading to change in other extreme Change in extreme of season leading to change in extreme of another season Change in extreme at one place leading to change in extreme to another place
Attempt is also made to see Ability of Models in simulating extremes Projection of Extremes Reconstruction of past Extremes using proxy data
IMD gridded data set Relationship between summer monsoon Precipitation extremes and khariffoodgrain production over India With preethi (2012 & 2013) Int. J. Climatology Analysis is also done for rabifoodgrain
PRECIS DATA Work in progress with CORDEX South Asia CORDEX ARAB
Background : The fourth assessment report of the Intergovernmental Panel on Climate Change (IPCC 2007) has concluded that the global mean surface temperatures have risen by 0.74 ± 0.18°C when estimated by a linear trend over the last 100 years (1906–2005). The rate of warming over the recent 50 years is almost double of that over the last 100 years (IPCC 2007), which is largely attributed to anthropogenic influences
Over India, the mean maximum as well as minimum temperatures have increased by about 0.2°C per decade during the period 1971–2003, for the country as a whole (Kothawale and Rupa Kumar 2005).
Trend in maximum and minimum temperature over North and South of 20N over India Recent study of Kothawale et al.,2012), TAC
Need of Analysis on Extremes Detection of change in climate against its variability is a key issue in climate research. Climate change is often expressed simply in terms of changes in mean climate.
Average conditions may not show appreciable change but may be characterized by a variety of extreme situations. Extremes could have more significant socio-economic consequences than the changes in mean
Extremes are an expression of the variability, therefore the nature of variability at different spatial and temporal scales is vital to our understanding of extremes.
Expert Team on Climate Change Detection and Indices (ETCCDI) coordinated the development of a suite of climate change indices which primarily focus on extremes. In all, 27 indices were defined which have been widely used for global and regional analyses of climate extremes. Present study is mainly based on same indices which are described at the link http://cccma.seos.uvic.ca/ETCCDMI/ .
INDICES OF TEMPERATURE EXTREMES FREQUENCY and SPELL DURATION INDICES : HOT EVENTS Number of Hot days (Tx > user defined threshold) Number of Hot nights (Tn > user defined threshold) Number of Hot days (Tx > 90th Percentile of Tx) Number of Hot nights (Tn > 90th percentile of Tn) Warm spell duration based on 90th percentile COLD EVENTS Number of Cold days (Tx < user defined threshold) Number of Cold nights (Tn < user defined threshold) Number of Cold days (Tx < 10th Percentile of Tx) Number of Cold nights (Tn < 10th percentile of Tn) Cold spell duration based on 10th percentile
INDICES OF TEMPERATURE EXTREMES INTENSITY INDICES : Hottest day temperature Hottest night temperature Coldest day temperature Coldest night temperature Diurnal temperature range Range of Extreme : Hottest day minus coldest night Growing Season Length The growing season is defined as starting when the temperature on five consecutive days exceeds 5 °C, and ends after five consecutive days of temperatures below 5 °C.
INDICES OF PRECIPITATION EXTREMES FREQUENCY INDICES : Number of days with RF > 10mm Number of days with RF > 20mm Number of days with RF > 30mm INTENSITY INDICES : One-day Maximum Precipitation Five-day Maximum Precipitation Daily Intensity (rainfall per rainydays)
INDICES OF PRECIPITATION EXTREMES Rainfall due to Heavy Rain events based on 95th percentile Rainfall due to Very Heavy Rain events based on 99th percentile Continuous Dry Days Continuous Wet Days
Extreme of a one place can be normal event of another place Basic analysis is done at station level/grid level. Applied preliminary quality checks on each station Used Well distributed station data
Once indices of extremes are computed for each station/grid further analysis is done to see changes Trend Analysis PDF Analysis mean Epochal mean Annual Cycle Regional means etc
For Extreme Analysis on South Asian Region : Role of altitude and latitude on changes in extremes over South Asia during 1971 – 2000 Revadekar et al., Int. J. Climatology, 33, 2013 Using 197 stations in Bangladesh, India, Nepal, Pakistan and Srilanka
INTENSITY SPELL DURATION
COLD EVENTS HOT EVENTS
Sign of trends in warm nights at stations with elevation > 500 m. Only trends with absolute value greater than 1.5 (%days/year) are shown. Circles represent negative trends and stars represent positive trends.
Mean Trends for categorized elevation Average trends are computed for a categorized elevation rank for four different categories: (1) <500 m; (2) 500–1000 m; (3) 1000–1500 m; and (4) >1500 m. Higher magnitude trends over high altitude are seen through TX10p, TX90p, WSDI, TXx
Precipitation Extremes using Aphrodite Computed indices of precipitation Extremes at each grid (0.5 x 0.5) using daily precipitation data for 1951 onwards for JF MAM JJAS OND Annual
Impact of System on R10mm Normal System Difference
RCM : PRECIS (Providing REgional Climates for Impacts Studies) developed by the Hadley Centre for Climate Prediction and Research, is applied for India to develop high-resolution climate change scenarios. The model has ~50 km resolution Simulations using PRECIS have been performed to generate the climate for present (1961-1990) and a future period (2071-2100) for two different socio-economic scenarios both characterized by regionally focused development but with priority to economic issues in one (A2 scenario) and to environmental issues in the other (B2 scenario). The model simulations are performed with and without including sulfur cycle, to understand the role of regional patterns of sulfate aerosols in climate change.
PRECIS Simulations of Future ClimateMean Annual Cycles of All-India Rainfall and Temperature
Coldest Night Temperature Both A2 and B2 scenarios show similar patterns of projected changes in the mean climate and extremes towards the end of 21st century. However, B2 scenario shows slight lower magnitudes of the projected changes than that of A2 scenarios. Similar features are seen other intensity indices also
Highest Maximum Temperature Seasonal changes in a2 scenarios : wide spread warming
Daily precipitation in a calendar year for base line, a2 and change
One-day maximum precipitation for base line, a2, b2 and change Both a2 and b2 show similarity in changes; A2 is higher than b2 Changes during summer monsoon are higher
International Conference on "Celebrating the Monsoon", 24-28 July 2007, Bangalore, India Scenarios for one-day and 5-day maximum. precipitation
Temperature and Precipitation Extremesusing CORDEXdaily maximum and minimum temperature
Validation of models for categorized elevation Similar to obsevational analysis Average trends are also computed for a categorized elevation rank for four different categories: (1) <500 m; (2) 500–1000 m; (3) 1000–1500 m; and (4) >1500 m. It is seen that models are able to capture elevation dependency in temperature extremes in addition to their spatial distribution
Seasonal Length (Number of days between tmean > 5C to tmean < 5C)Mean Seasonal length in RCP26 and RCP85 (TOP Panel)Incremental Changes in RCP26 and RCP85 w.r.t. Historical (bottom Panel)