Download
1 / 43
430 likes | 433 Views
This dataset includes observed meteorological parameters such as precipitation, temperature, humidity, wind, pressure, sunshine, and sea surface temperatures for the South Asian region. The data is available at different temporal and spatial scales and has been sourced from various data sources.

E N D
Observed climate data for South Asian region Jayashree Revadekar Centre for Climate Change Research Indian Institute of Tropical Meteorology Pashan, PUNE
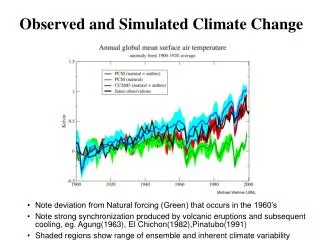
It is most important that any model simulated data be used only after prior evaluation of the model’s skills and reliability based on comparisons with the observations.
Meteorological Parameters Precipitation Maximum Temperature Minimum Temperature Mean Temperature Relative Humidity Wind Pressure Sunshine SST and indices......................etc....
Temporal Scale Annual Seasonal Monthly Weekly Pentad Daily Sub-daily
Spatial Scale Station/grid Region Country Monsoon Asia Global ...etc
Data Sources IITM IMD APHRODITE CPC CMAC CRU TRMM NCEP/NCAR NCDC
APHRODITE'S WATER RESOURCE Asian Precipitation Highly Resolved Observational Data Integration Towards Evaluation of water resources
Monsoon Asia (MA)60°E-150°E, 15°S-55°N Daily Data www.chikyu.ac.jp/precip/ Current Version V1101, V110R2, V1204R1 0.5° and 0.25° 180 x 140 elements for the period 1951-2007 (Precipitation) (Yatagai et al. 2011) For the period 1961-2007 (Temperature, Rain/Snow discrimination) (Yasutomi et al. 2011)
How to handle the dataset GrADS Control File Fortran 90 Program NetCDF (Matlab, GIS and many application can handle NetCDF)
Climate Research Unit(CRU) link http://www.cru.uea.ac.uk/
Data Availability * Temperature (5°×5° gridded versions) * Precipitation (5°×5° and 2.5°×3.75° gridded versions) * Pressure and Circulation Indices * Drought Indices * Alpine climate data * High-resolution gridded datasets And so on...........
Climate Prediction Centre Southern Asia Daily Rainfall Estimate ftp://ftp.cpc.ncep.noaa.gov/fews/S.Asia/
Daily rainfall estimation for southern Asia domain (70-110E;5-35N) beginning May 01, 2001. High Resolution 0.1 by 0.1 degree This product is updated three times daily at around 9am, 1pm, and 9pm Eastern Local Time and covers a 24 hour period of accumulated precipitation. Inputs include Global Telecommunication System (GTS) station data, as well as geostationary infrared cloud top temperature fields and polar orbiting satellite precipitation estimate data from SSM/I and AMSU-B microwave sensors.
NCEP/NCAR Reanalysis Link http://www.esrl.noaa.gov/psd/data/gridded/data.ncep.reanalysis.derived.html Daily and Monthly 1948 January to present Long-term means derived from data for years 1981-2010 Global
DATA DETAILS Pressure level Surface Surface Fluxers Other Fluxes Tropopause Surface : 2.5 x 2.5 (144x73) Global
CMAPCPC Merged Analysis of Precipitation Monthly and pentad Global Gridded 1979 to near present 2.5 x 2.5 (144x72) 88.75N-88.75S, 1.25E-358.75E http://www.esrl.noaa.gov/psd/data/gridded/data.ncep.reanalysis.derived.html
European Centre for Medium-Range Weather Forecasts (ECMWF) Link http://data-portal.ecmwf.int/ Datasets ERA Interim, ERA 40, ERA 15 etc.
ERA Interim Daily Data 1979 January to 2013 May Available for number of parameters 2.5 x 2.5
Earth System Research Laboratory (ESRL)Physical Sciences Division http://www.esrl.noaa.gov/psd/data/gridded/
Monthly Climatic Data for the World http://www.ncdc.noaa.gov/IPS/mcdw/mcdw.html May 1948 to April 2013 Station Data
Surface Latitude Longitude Elevation Pressure (Station and Sea Level) Temperature (Mean and Departure) Vapour Pressure (Mean and Departure) Precipitation (Rainy Days, Total rainfall, Departure, Quantile) Sunshine
REFERENCE NOTES Units : abbreviations: celsius = C, degrees = o, geopotential meters = gpm, meters = m, hectopascals = hPa,millimeters = mm, minutes = ', percent = %. The long term surface data AVERAGES required for these tables were calculated for 1961 - 1990 from data received at the National Climatic Data Center during those years. Six years of data were considered to be the minimum for calculations........ And so on
UPPER AIR DATAtemperature mean and dew point, wind For Levels 030 hPa 050 hPa 100 hPa 150 hPa 200 hPa 300 hPa 500 hPa 850 hPa 1005 hPa
IITM Data Archival Homogeneous Indian Monthly Rainfall Data Sets (1871-2012) All-India and Macro-Regional
Monthly Rainfall Data upto 1decimal in mm (1871-2012) ALL-INDIA RAINFALL (1871-2012) 30 SUB 2,880,324 SQ.KM. ALLIN1871R 196 107 144 339 636 2080 2778 1794 1835 368 323 67 ALLIN1872R 76 75 73 240 438 1892 2913 2451 1879 785 276 191 ALLIN1873R 36 135 150 243 428 1130 2644 2142 1656 607 115 89 .......................................................................................................................... ALLIN2012R 174 31 33 347 235 1123 2438 2410 1836 575 381 55 NORTHWEST INDIA RAINFALL (1871-2012) 6 SUB 634,272 SQ.KM. NWIND1871R 28 89 0 14 292 1212 1938 1151 305 19 142 52 NWIND1872R 50 19 16 16 99 796 1861 2177 715 3 0 59 and so on
IITM Data Archival Homogeneous Indian Monthly Rainfall Data Sets (1871-2012) Subdivisional Rainfall Data
IITM Data Archival Homogeneous Indian Monthly Surface Temperature (Minimum and Maximum) Data Sets (1901-2007) All-India and Regional
107 ALLIN: All-INDIA MAXIMUM TEMPERATURE (Degree Centigrade) ALLIN1901X 22.6 24.6 30.6 34.6 36.2 35.7 32.1 30.2 31.4 31.6 28.0 24.8 ALLIN1902X 25.4 27.6 32.4 34.6 36.5 35.1 31.7 31.4 30.3 30.2 27.0 23.9 ALLIN1903X 23.9 25.8 30.1 34.5 36.0 35.5 31.9 30.2 30.4 29.8 26.7 24.0 ALLIN1904X 23.5 26.1 30.1 35.3 35.7 33.8 30.7 30.4 31.0 30.7 27.1 24.1
India Meteorological DepartmentStation Data Sets Monthly Mean Maximum Temperature Minimum Temperature Monthly Total Rainfall
MUMBAI (SANTACRUZ)January February .........December Month January Year Maximum Minimum Rainfall 1951 30.2 14.3 0.0 1953 30.1 15.3 0.5
Regional Data Set Northwest, Central, Northeast and South Peninsula This is for Monsoon Months and season (JJAS) 1901-2009 Actual in mm and Departure in percentage
IMD Real-time Subdivisional weekly and station daily Maximum Temperature Minimum Temperature Precipitation Link : http://www.imdpune.gov.in/weather_forecasting/weather_index.html
IMD Real-time Gridded Rainfall Data for download Daily rainfall Summer Monsoon (JJAS) Indian Region
India Meteorological Department Link http://www.imdpune.gov.in/publication/pub_index.html NCC Gridded Data Product : Various time scales for 1x1 and 0.5x0.5 for rainfall and temperature Climatological Normals Monthly Rainfall Data series : 1901 to 2000 for districts, states, subdivisions and all-India Rainfall Atlas
Tropical Rainfall Measuring Mission(TRMM) It is joint NASA and JAXA mission to monitor and study tropical rainfall (trmm.gsfc.nasa.gov) 3 Hourly and 7 Day Rainfall Rain Averages Anomalies Climatology
Oceanic Parameters HadSST ERSST Nino Indices Ocean Fluxes (Troplex/OA Fluxes)