Download
1 / 51
770 likes | 1.47k Views
CHAPTER 3 TEMPERATURE AND HUMIDITY EXTREMES. Daily temperature variation. Each day is like a tiny season! Daytime heating, nighttime cooling Why do the high and low temperatures happen when they do?. Radiation inversion on calm vs. windy nights. The “diurnal cycle” of temperature.

E N D
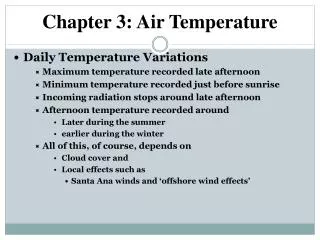
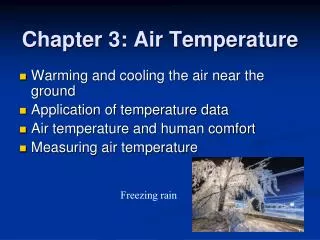
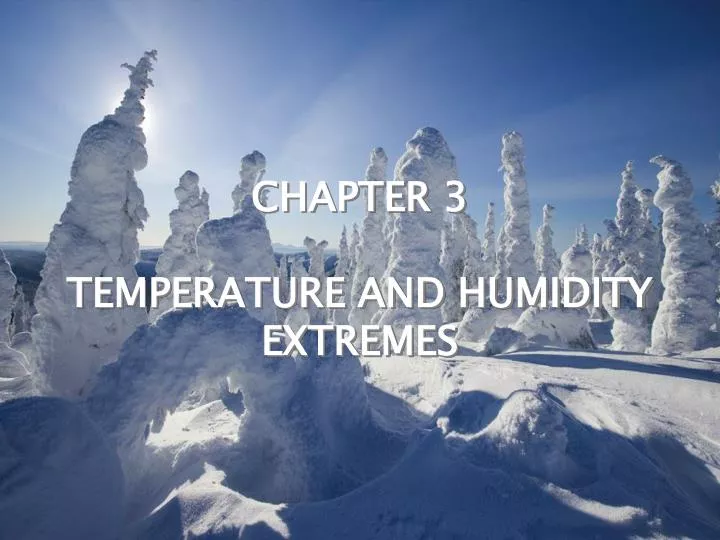
CHAPTER 3 TEMPERATURE AND HUMIDITY EXTREMES
Daily temperature variation • Each day is like a tiny season! • Daytime heating, nighttime cooling • Why do the high and low temperatures happen when they do?
The “diurnal cycle” of temperature • Daily temperature range near the ground is much greater than that above the ground!
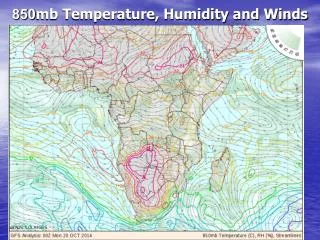
The Controls of Temperature • Latitude • Land and water distribution • Ocean currents • Elevation
Average temperature in JanuaryImportant: Adjusted for sea level!
Tale of three cities Fig. 3.14, p. 77
Temperature terms • (Note: these are kind of confusing!) • “Average temperature”: the average of the high and low temperature for the day • “Normal temperature”: a 30-year average
“Normal” temperature • Not once since 1952 has the high been exactly 62! • So, interpret the “normal” high with caution – what’s normal is for the temperature to be different each year!
CLL January 31 high temperature • Standard deviation = 11.5 • Mean +/- 2 standard deviations gives a range of about 39 to 85 – the high temperature will fall between these two values 95% of the time
WEATHER EXTREMES ANDHUMAN DISCOMFORT • Body’s Perception: Sensible temperature • How we exchange heat energy with environment • Wind and cold • Body, like the planet, must also have a heat/energy balance if temperature is to be maintained. • Thin layer of warm molecules next to skin • Wind interferes with this, rapidly removes heat • Sensible temperature for cold weather: Wind Chill
Cold Hazards • Frostbite: Skin actually freezes and discolors • Cold, Damp Weather • A cold rainy day often feels colder than a “dry” one because water on exposed skin conducts heat away from the body better than air does • Hypothermia – body temp drops below normal • Most hypothermia occurs between freezing and 50° F, snow vs. rain, the wet really matters! • “Died of Exposure”
Humidity: water vapor in the air • The maximum amount of water vapor that can be in the air is a function of temperature • The hotter it is, the greater amount of moisture that can be in the air • If this maximum amount of water vapor is actually in the air, the air is saturated • Usually the air near the ground is not saturated (but what might happen if it is?) • Most of the time, the amount of water vapor in the air stays about the same from day to night, even though the temperature goes up and down quite a bit
Humidity: water vapor in the air • Two types of humidity measures: absolute and relative • Absolute measures describe the actual amount of moisture in the air • Examples: absolute humidity, dewpoint temperature, specific humidity, mixing ratio • Relative humidity compares the amount of moisture in the air with the amount needed for saturation
Specific humidity • Mass of water vapor divided by mass of air • Must add or subtract water vapor to the parcel to change the specific humidity
Dew point temperature • Another absolute measure • Indicates how much you would have to cool the air to get to saturation. • The moisture needed for saturation at 60° is much less than at 80°. If the temperature is 80° and the dew point is 60°, you would have to cool the air 20° to have it be saturated
Other Absolute measures • Mixing Ratio – mass of water vapor over mass of dry air (how is this different from specific humidity?) • Vapor Pressure – The actual pressure only due to water vapor. • Both of these have actual values, and saturation values for the current temperature.
Relative humidity • Relative Humidity: (actual water vapor/saturation water vapor)*100 • Can use either mixing ratio or vapor pressure • RH can be changed two ways: • Change vapor content • Change saturation point (how?)
Dew Point (usually a better way to compare humidity) Fig. 3.20, p. 83
Current dew point map http://weather.unisys.com/surface/sfc_con_dewp.html
Humidity Extremes • Extreme Dew Points • Record high Td in the US occur during heat waves of summer • Td > 80°F rare in the US • Highest Td in the US (90°F): New Orleans, LA; Melbourne, FL; Appleton, WI • Extreme Dew Points • Highest Td in the world: Middle East near large bodies of extremely warm water • Red Sea: surface temperature of 98°F • Sharjah, United Arab Emirates, Td 93°F • Dhahran, Saudi Arabia, Td 95°F
Humidity + Heat (Effective Temperature) • Body cools by emitting infrared energy and perspiration evaporation • Less evaporation causes people to feel hotter (perception, remember!) • Air with 100% relative humidity is saturated because the air is holding as much water in the vapor state that it can hold (at that temperature) • The higher the relative humidity, the less evaporation
Heat index – factors in both temperature and humidity Fig. 3.24, p. 87
Heat Wave: A genuine severe/hazardous weather type • On average, the deadliest weather in U.S. • Prolonged period of abnormally hot (& humid, usually) weather • Almost 50,000 died in Europe in 2003
Mythbusters • “Air was so heavy and thick because of the humidity” (Yankees getting off the plane in Houston) • Humid Air and Dry Air Do Not Weigh the Same • At the same temperature and level in the atmosphere, hot, humid air is lighter (less dense) than hot, dry air • A molecule of water vapor (H2O) weighs appreciably less than a molecule of either nitrogen (N2) or oxygen (O2) • Still, it indeed does feel thick and heavy, related to perception and effective temperature.
Measuring temperature • Standards for a Cooperative Station thermometer: • Placed in a shelter 2 m above ground • Shelter must be painted white • Doors must open to the north (in the N. Hemisphere) • Vented sides • Placed on a grassy area where possible
Inside the shelter (photo from surfacestations.org)
How closely are the standards followed? • Generally good siting; station has been in same location for 100+ years Orland, California (photo from surfacestations.org)
How closely are the standards followed? • Not so good! Marysville, California (photo from surfacestations.org)
Humidity Measurement Now most stations have automated equipment which uses electronic means