Download
1 / 26
260 likes | 400 Views
Temperature and Precipitation Data. CBRFC Stakeholder Forum July 31, 2012. PRECIPITATION DATA – WHY IS THIS IMPORTANT ?. A direct input into the operational soil moisture & snow model. Primary Impacts: Immediate runoff from rainfall events

E N D
Temperature and Precipitation Data CBRFC Stakeholder Forum July 31, 2012
PRECIPITATION DATA– WHY IS THIS IMPORTANT ? A direct input into the operational soil moisture & snow model Primary Impacts: Immediate runoff from rainfall events Affects soil moisture conditions and seasonal volume forecasts Combined with temperature to build snowpack in the model TEMPERATURE DATA– WHY IS THIS IMPORTANT ? A direct input into the snow-17 operational model Primary Impacts: Determine precipitation type -> builds the snowpack Energy and heat transfer properties: Extent of snow cover When the snowpack ripens in the spring Process of melting the snowpack
Selection of Temperature & Precipitation Stations Starts with Calibration of the Model Simulated (yellow) Observed (blue) Simulated (yellow) Observed (blue) Data Site Requirements: Relevant location to the river basin and sufficient historical period of record. Must be stable through time (spent weeks verifying this through double mass analysis) Maintain consistency between calibration and daily operations (use same data sites) These requirements above tend to eliminate many candidates
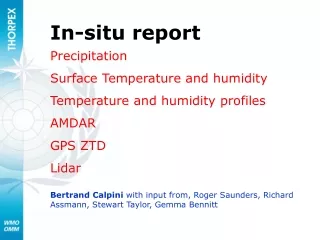
DATA NETWORKS SOURCES (Precipitation) ALERT Networks (Automated Local Evaluation in Real Time-Radio) GOES Data Collection Platforms (DCP) – includes Upper Colorado Network/RAWS/etc. SNOTEL * Cooperators * CoCoRaHS (Community Collaborative Rain, Hail & Snow Network) NEXRAD (Radar Products) Satellite Derived SOURCES (Temperature) GOES Data Collection Platforms (DCP) – includes Upper Colorado Network/RAWS/etc. * SNOTEL * Cooperators * * Data sources for model calibration
ALERT & CoCoRaHS Precipitation Data GOES DCP Precipitation Data
SNOTEL Precipitation Data Cooperator Network
Precipitation gauge sites used in our model for the San Juan Basin (subset of all available) calibrate and run operationally with the same data (260 sites for CBRFC)
Temperature sites in the model for the San Juan Basin Calibrate and run operationally with the same data (330 sites for CBRFC)
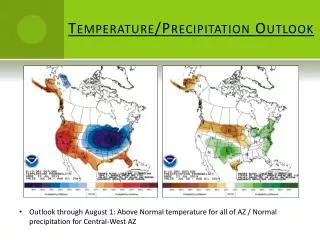
Additional Precipitation Source – NEXRAD Radar Derived Precipitation No radar coverage Much less in winter
Areas where radar precipitation data may be used (rainfall-runoff hydrology dominates) as input to the hydrologic model. Hourly radar precipitation data is used in southern Utah, Arizona, and New Mexico (1-hour segments) The option exists to use radar precipitation data in northern Utah and Colorado during summer months (6-hour segments)
Precipitation Source – Hourly Multi-Precipitation Editor (MPE generated Precipitation) Radar derived precipitation and gage precipitation are combined to generate an hourly gridded product ingested by our hydrologic model Satellite derived precipitation is available
Goal: Combine all precipitation sources into to a coherent precipitation product
Goal: Combine all precip& temperature data sources into a coherent product Quality Check All Data - Use all sites all sources - Meteorological situation - Affects gauge performance - Expected precipitation patterns False
So what gets in the Model (and Forecast) ? Quality Check All Data - Use all sites all sources - Meteorological situation - Affects gauge performance Convert point 24/6 hour gauge data, to a Mean Areal Precipitation value (MAP). Uses only a subset of all sites available. Time step = 6 hours. Convert point data to Mean Areal Temperature (MAT). Time step = 6 hours. Incorporates radar data (MPE) to create a Mean Areal Precipitation (MAP) value. Time step = 1 hour. Observed data (and Forecast precipitation & temperature ) are re-evaluated by forecaster interacting with the model during the daily operational run.
Dolores – Dolores (DOLC2) Segment (below Rico) SAC-SMA Model Sub-Areas What is a MAP? Example of Stations used to generate Mean Areal Precipitation LNCC2 (9600 ft) Stations used to compute precipitation & their weighting (locations approximate) EDSC2 (10,200 ft) LIZC2 (10,200 ft) Middle (8500-11500) El Diente Peak (EDSC2) SNOTEL (.34) Lone Cone (LNCC2) SNOTEL (.17) Scotch Creek (SHSC2) SNOTEL (.34) Dolores- Rico Segment (DRRC2) SHSC2 (9100 ft) Lower (7067-8500) Cortez (CTZC2) Precipitation (1.2) Upper (11000-12644) Lizard Head (LIZC2) SNOTEL (.55) El Diente Peak (EDSC2) SNOTEL (.55) CTZC2 (6153 ft)
Operational Model Run 07/25 Noon-6 pm Precipitation for Dolores @ Dolores
Operational Model Run 07/25 6pm-Midnight Precipitation for Dolores @ Dolores
Operational Model Run for Dolores @ Dolores / Precipitation 07/25 Noon-Midnight Observed Model simulated
6/24 hour gauge data is used to create MAP’s in the Great Basin and Upper Colorado Basin
SUMMARY • Temperature and Precipitation observing networks are critical as they provide direct inputs into our hydrologic models and drive the streamflow forecasts. • Immediate direct runoff (rainfall-runoff situation) • Soil moisture states (long term volumes & peaks) • Snowpack • Maintaining existing networks is critical to our forecast abilities • Great deal of effort verifying gauge is stable through time. • Priority given to those sites utilized in calibration / long period of records • SNOTEL Network our most critical network • The loss of any site risks degradation of overall data quality & resulting forecasts • Surface network especially critical in West due to radar limitations • Consequences of bad (or limited data) are somewhat obvious • Negatively impact ability to quality control observed data • Misrepresentation of snowpack (seasonal & peak flow implications) • Incorrect classification of precipitation types (further impact model states) • Results: Poor model simulations, missed flood events, poor seasonal forecasts.