Download

1 / 29
290 likes | 465 Views
Research Methods 1998 Graphical design and analysis. Ó Gerry Quinn, Monash University, 1998 Do not modify or distribute without expressed written permission of author. Graphical displays. Exploration assumptions (normality, equal variances) unusual values which analysis? Analysis

E N D
Research Methods 1998Graphical design and analysis Ó Gerry Quinn, Monash University, 1998 Do not modify or distribute without expressed written permission of author.
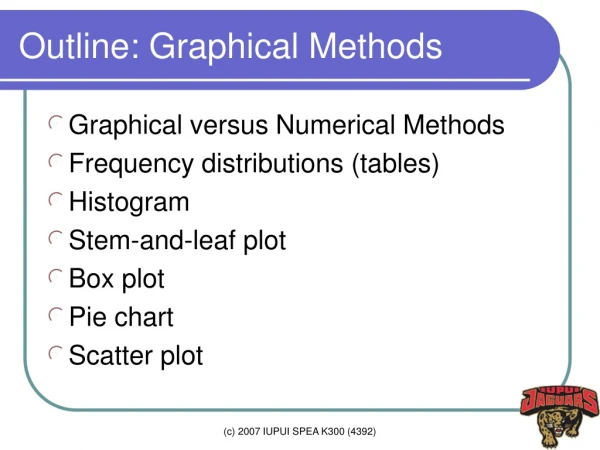
Graphical displays • Exploration • assumptions (normality, equal variances) • unusual values • which analysis? • Analysis • model fitting • Presentation/communication of results
Space shuttle data • NASA meeting Jan 27th 1986 • day before launch of shuttle Challenger • Concern about low air temperatures at launch • Affect O-rings that seal joints of rocket motors • Previous data studied
3 2 Number of incidents 1 0 50 55 60 65 70 75 80 85 Joint temp. oF O-ring failure vs temperature Pre 1986
Challenger flight Jan 28th 1986 - forecast temp 31oF
3 2 Number of incidents 1 0 50 55 60 65 70 75 80 85 o Joint temp. F O-ring failure vs temperature
Checking assumptions - exploratory data analysis (EDA) • Shape of sample (and therefore population) • is distribution normal (symmetrical) or skewed? • Spread of sample • are variances similar in different groups? • Are outliers present • observations very different from the rest of the sample?
Pr(y) y Pr(y) y Distributions of biological data • Bell-shaped symmetrical distribution: • normal • Skewed asymmetrical distribution: • log-normal • poisson
Common skewed distributions Log-normal distribution: • m proportional to s • measurement data, e.g. length, weight etc. Poisson distribution: • m = s2 • count data, e.g. numbers of individuals
Example data set • Quinn & Keough (in press) • Surveys of 8 rocky shores along Point Nepean coast • 10 sampling times (1988 - 1993) • 15 quadrats (0.25m2) at each site • Numbers of all gastropod species and % cover of macroalgae recorded from each quadrat
Frequency distributions Observations grouped into classes NORMAL LOG-NORMAL Number of observations Value of variable (class) Value of variable (class)
Number of Cellana per quadrat 30 Survey 5, all shores combined Total no. quadrats = 120 20 Frequency 10 0 0 20 40 60 80 100 Number of Cellana per quadrat
Dotplots • Each observation represented by a dot • Number of Cellana per quadrat, Cheviot Beach survey 5 • No. quadrats = 15 0 10 20 30 40 Number of Cellana per quadrat
outlier * largest value } 25% of values hinge VARIABLE } " median spread } " hinge } " smallest value GROUP Boxplot
1. IDEAL 2. SKEWED 3. OUTLIERS 4. UNEQUAL VARIANCES * * * * *
Boxplots of Cellana numbers in survey 5 100 80 60 Number of Cellana per quadrat 40 20 0 S FPE RR SP CPE CB LB CPW Site
Scatterplots • Plotting bivariate data • Value of two variables recorded for each observation • Each variable plotted on one axis (x or y) • Symbols represent each observation • Assess relationship between two variables
40 30 20 10 0 0 10 20 30 40 50 60 70 Cheviot Beach survey 5 n = 15 Number of Cellana per quadrat % cover of Hormosira per quadrat
Scatterplot matrix • Abbreviated to SPLOM • Extension of scatterplot • For plotting relationships between 3 or more variables on one plot • Bivariate plots in multiple panels on SPLOM
SPLOM for Cheviot Beach survey 5 CELLANA - numbers of Cellana SIPHALL - numbers of Siphonaria HORMOS - % cover of Hormosira n = 15 quadrats
Transformations • Improve normality. • Remove relationship between mean and variance. • Make variances more similar in different populations. • Reduce influence of outliers. • Make relationships between variables more linear (regression analysis).
Log transformation Lognormal Normal y = log(y) Measurement data
Power transformation Poisson Normal y = Ö(y), i.e. y = y0.5, y = y0.25 Count data
Arcsin Ö transformation Square Normal y = sin-1(Ö(y)) Proportions and percentages
Outliers • Observations very different from rest of sample - identified in boxplots. • Check if mistakes (e.g. typos, broken measuring device) - if so, omit. • Extreme values in skewed distribution - transform. • Alternatively, do analysis twice - outliers in and outliers excluded. Worry if influential.
Assumptions not met? • Check and deal with outliers • Transformation • might fix non-normality and unequal variances • Nonparametric rank test • does not assume normality • does assume similar variances • Mann-Whitney-Wilcoxon • only suitable for simple analyses
Cheviot Beach Sorrento 30 30 25 25 20 20 Mean number of Cellana per quadrat 15 15 10 10 5 5 0 0 1 2 3 4 5 6 7 8 9 10 1 2 3 4 5 6 7 8 9 10 Survey Category or line plot Mean number of Cellana per quadrat Survey