Download
1 / 15
150 likes | 178 Views
Graphical Analysis. Let’s Review. VELOCITY is the SLOPE of a distance, position, or displacement vs. time graph. Let’s Review. What is the slope doing?. INCREASING. What is the velocity doing?. INCREASING. Let’s Review. Let’s Review. Describe the acceleration during interval A.

E N D
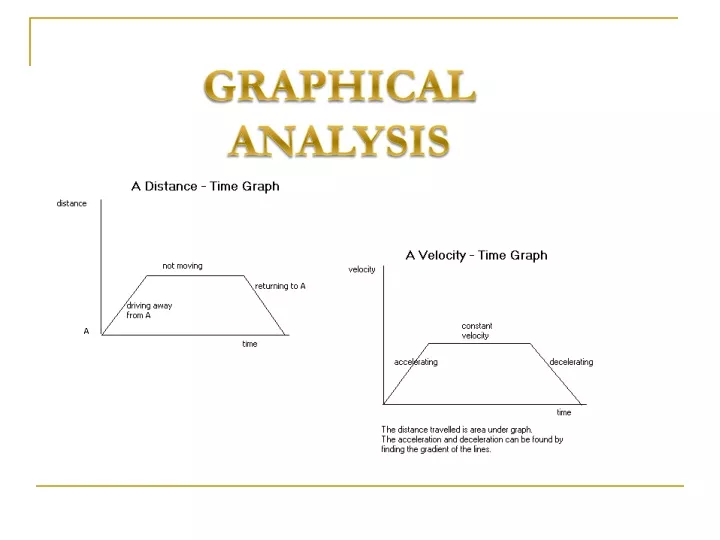
Let’s Review VELOCITY is the SLOPE of a distance, position, or displacement vs. time graph.
Let’s Review What is the slope doing? INCREASING What is the velocity doing? INCREASING
Let’s Review Describe the acceleration during interval A. The acceleration or SLOPE is constant and positive. Describe the acceleration during interval B. The acceleration or SLOPE is ZERO. Describe the acceleration during interval C. The acceleration or SLOPE is constant and negative.
Let’s Review What is the acceleration(slope) doing? The acceleration is INCREASING!
Let’s Review The slopes help us sketch the motion of other graphs!
The Area Model How FAR did this object travel during interval A? How FAR did this object travel during interval B? How FAR did this object travel during interval c?
The Area Model What is the change in Velocity during the t=2 to t=4 interval? Dv
In summary v (m/s) a (m/s/s) slope = v x (m) slope = a area = v area = x t (s) t (s) t (s)
Comparing and Sketching graphs One of the more difficult applications of graphs in physics is when given a certain type of graph and asked to draw a different type of graph List 2 adjectives to describe the SLOPE or VELOCITY The slope is CONSTANT slope = v x (m) The slope is POSITIVE t (s) v (m/s) How could you translate what the SLOPE is doing on the graph ABOVE to the Y axis on the graph to the right? t (s)
Example v (m/s) x (m) t (s) t (s) 1st line 2nd line The slope is constant The slope is “0” The slope is “-” 3rd line The slope is “+” The slope is constant
Example – Graph Matching What is the SLOPE(a) doing? a (m/s/s) The slope is increasing v (m/s) t (s) a (m/s/s) t (s) a (m/s/s) t (s) t (s)