Download
1 / 61
610 likes | 762 Views
Lecture 6. Atmospheric Effects and Corrections . Terminology. Radiant flux Irradiance Radiance Reflection Transmittance. Radiance received at a remote sensor. Radiance ( L T ) from paths 1, 3, and 5 contains intrinsic valuable spectral information about the target of interest.

E N D
Lecture 6 Atmospheric Effects and Corrections
Terminology • Radiant flux • Irradiance • Radiance • Reflection • Transmittance
Radiance received at a remote sensor Radiance (LT) from paths 1, 3, and 5 contains intrinsic valuable spectral information about the target of interest. Conversely, the path radiance (Lp) from paths 2 and 4 includes diffuse sky irradiance or radiance from neighboring areas on the ground. This path radiance generally introduces unwanted radiometric noise in the remotely sensed data and complicates the image interpretation process.
Radiance received at a remote sensor • Path 1 contains spectral solar irradiance ( Eo) that was attenuated very little before illuminating the terrain within the IFOV. • We are interested in the solar irradiance from a specific solar zenith angle ( θo) • The amount of irradiance reaching the terrain is a function of the atmospheric transmittance at this angle (Tθo). • If all of the irradiance makes it to the ground, then the atmospheric transmittance equals one. If none of the irradiance makes it to the ground, then the atmospheric transmittance is zero.
Radiance received at a remote sensor • Path 2 contains spectral diffuse sky irradiance ( Ed ) that never reaches the the target study area because of scattering in the atmosphere. • This energy is often scattered into the IFOV of the sensor system. • Rayleigh scattering of blue light contributes much to this diffuse sky irradiance. Hence blue band image produced by a remote sensor system is often much brighter than any of the other bands and contains much unwanted diffuse sky irradiance that was scattered into the IFOV of the sensor system. • Therefore, if possible, we want to minimize its effects. This quantity is referred to as the upward reflectance of the atmosphere (Edu).
Radiance received at a remote sensor • Path 3 containsmodified energyfrom the Sun that has undergone some Rayleigh, Mie, and/or nonselective scattering and perhaps some absorption and reemission before illuminating the study area. • Its spectral composition and polarization may be somewhat different from the energy that reaches the ground from path 1. • This quantity is also referred to as the downward reflectance of the atmosphere (Edu).
Radiance received at a remote sensor • Path 4contains radiation that was reflected or scattered by nearby terrain covered by snow, concrete, soil, water, and/or vegetation into the IFOV of the sensor system. • The energy does not actually illuminate the study area of interest. Therefore, if possible, we would like to minimize its effects. • Path 2 and Path 4 combine to produce what is commonly referred to as Path Radiance, Lp.
Radiance received at a remote sensor Path 5 is energy that was also reflected from nearby terrain into the atmosphere, but then scattered or reflected onto the study area. Generally insignificant.
Radiance received at a remote sensor Images are arrays of pixels, where each pixel is represented by a brightness value or grey level, generally between 0 and 255. These values are called DNs. We can determine the radiance at the sensor for any pixel from its DN value, between0 and 255: where LmaxandLminare maximum and minimum measurable radiances of the sensor. k and Lminare also called gain and offset of the detector. This information is provided by the sensor manufacturer.
Radiance received at a remote sensor Preflight TM-4 and TM-5 spectral range values (from NASA, 1986, Table C-8) For band 1, k = (152.1+1.5)/255 = 0.602353 L pix = (100 x 0.602353 ) – 1.5 = 58.73 W/m2/sr/μm For band 7, k = (14.38+0.15)/255 = 0.05698 Lpix = (100 x 0.05698) – 0.15 = 5.54 W/m2/sr/μm DN value of a pixel in bands 1 and 7 is 100 Maximum DN value in both bands is 255 Radiance at the pixel in band 1? In band 7??
Radiance received at a remote sensor The irradiance (Esunλ) of the sun in a specific length (λ) at a solar zenith angle of θis Remote sensing systems sense wavebands, rather than specific wavelengths. The available irradiance (Eo) in a specific wave band between λ1 and λ2 in the area of interest is or or where Δλ = λ2- λ1 is very small and Esun Δ λ is the average irradiance in the band Δλ. d2 (in AU)accounts for varying distance of earth from the Sun. If the reflectance of the pixel of interest is R, then the radiant exitance of the pixel is: We know that
However the atmosphere scatters and absorbs a proportion of the solar irradiance. If the scattered or diffused sky irradiance is Ed and Tθo is the atmospheric transmission, i.e., the proportion of radiance transmitted by the atmosphere, in the direction θo, then the total irradiance at the pixel = Radiance received at a remote sensor The radiance from the pixel due to this irradiance = R is the reflectance. If the atmospheric transmission in the direction θv is Tθv , then the radiance Lsensor arriving at the sensor after traversing the atmosphere is: Where Lpath is path radiance.
Bidirectional Reflectance Distribution Function The bidirectional reflectance distribution function (BRDF) is a theoretical concept that describes the relationship between the geometric characteristics of the solar irradiance, and the remote sensing system viewing geometry; hence the bidirectional terminology (Sandmeier, 1996; Jensen, 2000)
Bidirectional Reflectance Distribution Function • The accurate computation of BRDF required for: • Making corrections to reflectance measurements of features measuredfrom nadir or off-nadir pointing remote sensing systems. • To identify bands that are least impacted by BRDF, recognize optimal sun/sensor angle-of-views, and provide insight into radiometrically adjusting remotely sensed data to minimize BRDF effects.
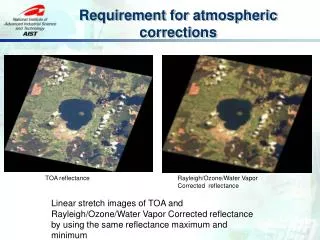
Objectives of atmospheric corrections • High goal of remote sensing: • To identify the composition of objects on ground from remote sensing data • Spectral reflectance curves are used for this purpose • However, radiance-at-the-sensor is contaminated by path radiance due to the atmosphere, hence spectral reflectance estimated from remote sensing data are incorrect • We have to correct the radiance-at-the-sensor to remove atmospheric effects
When is the atmospheric correction really required?? • Mono-temporal data : NO • Classification: NO • Change monitoring and detection: YES • Composition mapping, spectral analysis: YES
Radiometric calibration DN Sensor calibration • gain and offset Radiance at sensor • image measurement • ground measurements • atmospheric models • sensor view path atmospheric radiance • sensor view path atmospheric transmittance Atmospheric correction Radiance at ground • solar angle, DEM BRDF/Topographic correction Surface reflectance
Atmospheric corrections: Techniques • Histogram minimum method aka dark object subtraction – the bootstrap approach • Empirical line method • Radiativetransfer models – Physical-based approach
Estimation of LP : Dark object subtraction • Dark-object subtraction techniques derive the corrected DN (digital number) values solely from the digital data with no outside information. • This type of correction involves subtracting a constant DN value from the entire digital image. • The assumption is that there is a high probability that at least a few pixels within an image which should be black (0% reflectance). If there are no pixels with zero values, that is the effect of atmospheric scattering • For example, there are about 45 million pixels in a single TM band – so there very high probability that at least one of them should be black.
Estimation of LP : Dark object subtraction Water bodies have 0% reflectance in the IR region, hence zero DN Non-zero values over water bodies in the IR consequence of path radiance. Subtract the non-zero value over water bodies from all pixels. That would make water body perfectly non-reflecting. In Visible bands, shadows should be black in absence of path radiance. Hence non-zero values over shadowed areas can be used for dark pixel correction. Water absorption Water absorption
Estimation of LP : Dark object subtraction • Histograms of pixel values in all bands • pixel values of low reflectance areas near zero • exposures of dark colored rocks • deep shadows • clear water • Lowest pixel values in visible and near-infrared are approximation to atmospheric path radiance • Minimum values subtracted from image
Estimation of LP : Dark object subtraction Eg Multispectral – can be applied to hyperspectral as well How will you calculate path radiance for all bands ?? For example, calculate path radiance for a pixel whose DN value is 53 in band 1.
Estimation of LP : Dark object subtraction How will you calculate path radiance for all bands ?? For example, calculate path radiance for a pixel whose DN value is 53 in band 1.
Estimation of LP : Dark object subtraction Regression technique • DN values of correlated bands are plotted • Least square line fit using standard regression methods • Resulting offset is approximation for the atmospheric path radiance offset subtracted from image
Estimation of LP : Dark object subtraction Regression technique Does it always work? • The key criterion of atmospheric correction algorithm - • ….. Quantify atmospheric influences on satellite image radiometry but at the same time insensitive to surface reflection effects
Estimation of LP : Dark object subtraction Regression technique So how to correct this image?
Estimation of LP : Haze Removal Algorithm Haze Optimization Transform (HOT) Y. Zhang et al., 2002 (RSE) • Manually select several clear and hazy area pixels in the image • Two spectral bands are selected based on the following criteria: • The spectral responses of different land cover types, under clear atmospheric conditions, should be highly correlated in the two bands. This will result in a well-defined surface response vector in spectral space called “clear line” (CL) • The effect of haze should be markedly different in the two bands so that increased atmospheric contamination manifests in increased shift away from the CL • Typically we would select blue and red bands • Apply a transformation whose coefficients define a direction orthogonal to the CL and whose response magnitude is proportional to the deviation from this line
Estimation of LP : Haze Removal Algorithm Haze Optimization Transform (HOT) Y. Zhang et al., 2002 (RSE) Schematic diagram of the TM1 – TM3 spectral space illustrating the conceptual components of the HOT. Under clear sky conditions, radiances of common surface cover types, coded as A – K, exhibit high correlation and define a ‘clear line’ (CL). The effect of haze of increasing optical depth, illustrated by the numerical sequences 1 – 18, is to pixels to ‘migrate’ away from the CL. The HOT quantifies the atmospheric contamination level at a pixel location by its perpendicular distance, in spectral space, from the CL.
Estimation of LP : Haze Removal Algorithm Haze Optimization Transform (HOT) Y. Zhang et al., 2002 (RemSensEnv)
Estimation of LP : Haze Removal Algorithm Haze Optimization Transform (HOT) Clear line Select two correlated bands (bands showing similar reflectance characteristics for all objects) but affected by scattering due to atmospheric components to different degrees. Example: Bands 1 (Blue) and 3 (Red) of ETM/TM Haze vector α slope = α and offset on x axis = β
Estimation of LP : Haze Removal Algorithm Haze Optimization Transform (HOT) 2. Mask out areas with obvious haze 3. Select some very clear areas that are unaffected by clouds/haze)
Estimation of LP : Haze Removal Algorithm Haze Optimization Transform (HOT) Clear line Clear line . . . . . . . . . . . . . . . . Band 3 (Red) . . . . . . . . . . . . . . . . . . . . . . . . . . . . . . . . . . . . . . . . . . . . Haze vector . . . . . . . . . . α . . . . Haze vector . . . . . . . . . . . . . . . . . . . . . . . . . . . . . . . . . . . . . . . . . . . . . . . . . . . . slope = α and offset on x axis = β . . 4. Plot DN (Blue band – X axis) vs DN (Red band – Y axis) of pixels from clear area . . . . . . . . . . 5. Fit the pixel DNs to the clear line generated by linear regression (slope = α and offset β on x axis. Band 1 (Blue) 6. Haze vector is orthogonal to clearline
Clear line Estimation of LP : Haze Removal Algorithm Haze Optimization Transform (HOT) 7. Plot clear line Clear line 8. Plot all DN (Blue) v/s DN(Red) for all pixels on the image 9. Haze vector is orthogonal to clear line, hence you can identify haze pixels . . . . . . . . . . . . . . . . 10. Calculate HOT for all pixels as the offset of a pixel from the clear line in the haze vector direction . . . . . . . . . . . . . . . . . . . . . . . . . . . . . . . . . . . . . . . . . . . . . . . . . . . . . . . . . . . . . . . . . . . . . . . . . . . . . . . . . . . . . . . . . . . . . . . . . . . . . . . . . . . . Band 3 (Red) . . . . . . . . . . . . . . . . . . . . . . . . . . . . . . . . . . . . . . . . . . . . . . . . . . . . . . . . . . . . . . . . . . . . . . . . . . . . . . . . . . . . . . . . . . . . . . . . . . . . . . . . . . . . . . . . . . . . . . . . . . . . . . . . . . . . . . . . . . . . . . . . . . . . . . . . . . . . . . . . . . . . . . . . . . . . . . . . . . . . . . . . . . . . . . . . . . . . . . . . . . . . . . . . . . . . . . . . . . . . . . . . . . . . . . . . . . . . . . . . . . . . . . . . . . . . . . . . . . . . . . . . . . . . . . . . . . . . . . . . . . . . . . . . . . . . . . . . . . . . . . . . . . . . . . . . . . . . . . . . . . . . . . . . . . . . . . . . . . . . . . . . . . . . . . . . . . . . Haze vector . . . . . . . . . . . . . . . . . . . . . . . . . . . . . . . . . . . . . . . . . . . . . . . . . . . . . . . . . . . . . . . . . . . . . . . . . . . . . . . . . . . . . . . . . . . . . . . . . . . . . . . . . . . . . . . . . . . . . . . . . . . . . . . . . . . . . . . . . . . . . . . . . . . . . . . . . . . . . . . . . . . . . . . . . . . . . . . . . . . . . . . . . . . . . . . . . . . . . . . . . . . . . . . . . . . . . . . . . . . . . . . . . . . . . . . . . . . . . . . . . . . . . . . . . . . . . . . . . . . . . . . . . . . . . . . . . . . . . . . . . . . . . . . . . . . . . . . . . . . . . . . . . . . . . . . . . . . . . . . . . . . . . . . . . . . . . . . . . . . . . . . . . . . . . . . . . . . . . . Band 1 (Blue) α β
Estimation of LP : Haze Removal Algorithm Haze Optimization Transform (HOT) 11. Generate HOT Image and determine the HOT values for clear areas and hazy areas (Not the same image as in the previous slide)
Estimation of LP : Haze Removal Algorithm Haze Optimization Transform (HOT) Clear areas 12. Plot HOT histogram for different HOT levels for clear and hazy areas Increasing HOT = > Increasing Haze Haze areas
Estimation of LP : Haze Removal Algorithm Haze Optimization Transform (HOT) 13. histogram lower bound versus HOT for bands TM1–TM3 14. Estimate radiometric adjustment using a method similar to “dark object subtraction” to normalize the image to the radiometric level of the clearest areas. DN Clear pixel From Step 13 plot, note that, for Band TM 1 (Blue), the histogram lower bound for clear pixels (i.e., HOT= 30) is approximately 20 DNs. Consider a hazy pixel with an observed HOT level of 40. It is a member of a histogram with a lower bound 27. This implies that this hazy pixel should have its band 1 DN level reduced by 7 during the radiometric adjustment phase. This procedure can be used to adjust all bands for which the histogram analysis has been done.
Estimation of LP : Haze Removal Algorithm Haze Optimization Transform (HOT)
Result Estimation of LP : Haze Removal Algorithm Haze Optimization Transform (HOT)Results
Empirical line method • One dark (X1) and one bright (X2) object selected on the image which can be clearly identified on the ground also • Ground reflectance of X1 and X2 measured using field radiometer (R X1 and R X2). • Radiance-at-the-sensor of X1 and X2 measured using field radiometer (L X1 and L X2). • The two points plotted on a graph, joined by a line, and the slope (s) and intercept (a) of the line measured. • Equation of the line derived, used for converting all radiance values into reflectance values • R = (L-a)*s R - Reflectance a - Offset s - Slope
Model-based atmospheric corrections -Visibility • The farthest distance at which one can see a large, black object against the sky at the horizon. It is determined by: • optical properties of the atmosphere; • amount and distribution of light; • characteristics of the objects observed; • properties of the human eye. • Visibility is reduced by the absorption and scattering of light by both gases and particles. However, light scattering by particles is the most important phenomenon responsible for visibility degradation. • In clean (background) atmospheric conditions, one can see over distances up to several hundred kms; in polluted atmospheric conditions, visibility is up to 10 km. • (Koschmieder equation) • where is the extinction coefficient (per sq km) at 550 nm. It is the sum of extinction coefficients of all gases and particles, which attenuate light, and is therefore a measure of the loss of radiation per unit distance
Optical thickness Optical thickness (δ) is defined as the product of the extinction coefficient and the path length, x, e.g., from the sea level to space in a vertical path: Optical thickness due to molecular scattering (mainly due to N2 and O2) depends only on the pressure level and can be calculated for a given ground elevation. Optical thickness due to molecular absorption due to O3 and CO2 can be averaged over large areas. Optical thickness due to water vapour absorption is significant and varies with time and space. Therefore, the total optical thickness can be considered a function of aerosol optical thickness (AOT),and water vapour absorption which varies strongly in time and space.
Algorithms for atmospheric corrections • ATmosphericCORrection (ATCOR) • ATmosphereREMoval (ATREM) • Fast Line-of-sight Atmospheric Analysis of Spectral Hypercubes (FLAASH) • All the above algorithms use radiative transfer models of atmosphere such as MODerate resolution atmospheric TRANsmission (MODTRAN)
ATCOR (ATmosphericCORrection) algorithm for atmosphere corrected reflectance estimation where d2 takes into account the sun-to-earth distance (in AU), because the LUTs for path radiance and global flux are calculated for d=1 in ATCOR