Download
1 / 43
430 likes | 555 Views
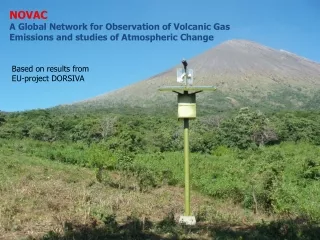
Atmospheric effects of volcanic bromine emissions. Taryn M. Lopez UAF Department of Chemistry and Biochemistry. www.usgs.gov. Importance of volcanic emissions. Source of trace gases & aerosols to the atmosphere. Volcano monitoring. www.wikipedia.com/.

E N D
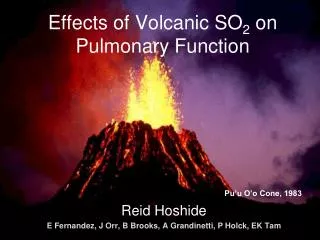
Atmospheric effects of volcanic bromine emissions Taryn M. Lopez UAF Department of Chemistry and Biochemistry
www.usgs.gov Importance of volcanic emissions Source of trace gases & aerosols to the atmosphere Volcano monitoring www.wikipedia.com/ Doukas and McGee, USGS Open File Report, 2007
Average Composition of an H2O-Rich Magmatic Gas Gerlach, G Cubed, 2004
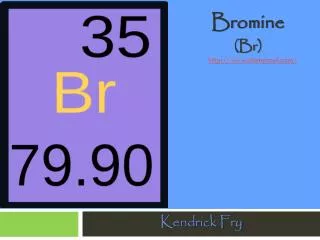
Bromine • Halogen element • Natural reservoirs: saltwater and the earth’s crust http://minerals.usgs.gov/minerals/pubs/commodity/bromine/) • Abundance in Oceans ~67.3 parts per million (ppm by weight)www.eoearth.org • Abundance Earth’s crust ~3 ppm (by weight) http://en.wikipedia.org/wiki/Abundance_of_elements_in_Earth's_crust • Abundance in Atmosphere ~0.5 – 2 parts per trillion (by volume) • (von Glasow et al, Atmos. Chem. Phys. Discuss., 2004) www.periodictable.com
Annual Global Emissions of HBr (Tg) Cadle, Reviews of Geophysics and Space Physics, 1980
First detection of volcanic BrO • Soufriere Hills volcano, Montserrat, West Indies • Bobrowski and others, 2002 www.mvo.ms Bobrowski et al., Nature, 2003
Scanning Multiaxis (MAX) DOAS • Entrance optics (0.6 deg FOV) • Quartz optical fibers • Ocean Optics USB 2000 UV/Vis spectrometer • Internal stepper motor • Temperature stabilized to 10 deg C Bobrowski et al, JGR, 2007
Ocean Optics Spectrometer www.oceanoptics.com
Ocean Optics Spectrometer www.oceanoptics.com
Ocean Optics Spectrometer www.oceanoptics.com
Beer-Lambert Law A = -log10 (I/Io) = εcl(Chemistry) -ln(I/Io) = σNL (Physics) Io = Incident light ε = Molar absorptivity c = Concentration l = Path length I = Transmitted light σ = Absorption x-section N = Concentration L = Path length
Reference Spectrum Sample Spectrum MAX DOAS Application of Beer’s Law
Reference Spectrum Sample Spectrum Reference Spectrum MAX DOAS
Wahner et al., Chem. Phys. Letters, 1988; Weibring, Diploma Thesis, 1986
MAX DOAS MAX-DOAS methodology From Bobrowski et al., Nature, 2003
Volcanoes: A significant source of atmospheric BrO! • BrO slant column density (SCD) of 2 x 10¹⁵ molecules/cm2 • Derived mixing ratio ~ 1 ppbv BrO • Estimated emission rate 8.4 x 10²² molecules/s or ~350 t reactive Br/year • Global estimate of Br from volcanoes 14 +/- 6 Tg/year ~ 30,000 t Br/year *Using these estimates and total global Br source flux to the atmosphere of ~60 – 120 molec/cm3/s (von Glasow, 2004); volcanic bromine makes up ~ 0.8 – 1.6% of total! (1 molec/cm3/s) Bobrowski et al., Nature, 2003
Effects? BrO• Source?
Effects? BrO• Redox Chemistry! Source?
Effects? Ozone depletion! BrO• Redox Chemistry! Source?
BrO formation in volcanic plumes • Case studies: Mt. Etna volcano, Italy Oppenheimer et al., Geochimica Acta, 2006 & Bobrowski et al., JGR, 2007 • Collected BrO and SO2 SCD measurements at 0 km and downwind from source Oppenheimer et al., Geochimica Acta, 2006 Image Science and Analysis Laboratory, NASA-Johnson Space Center
BrO concentrations increase with time • Observed an increase in BrO/SO2 downwind from plume source • BrO values below detection limit near vent • BrO/SO2 ~ 4.5 x 10⁻⁴ at 19 km downwind • Noticed higher BrO/SO2 at the edges of plume Bobrowski et al., GRL, 2007
BrO concentrations increase with time Oppenheimer et al., Geochimica Acta, 2006
Where does the BrO come from? • HBr found in fluid inclusions in volcanic rocks and in gas condensates (Bureau et al., EPSL, 2000; Gerlach et al., G Cubed, 2004) • HBr is the thermodynamically stable Br species in magma and the atmosphere (Oppenheimer et al., Geochimica Acta, 2006)
Conversion of HBr to BrO Gas Phase RXN: (1) HBrg + ∙OHg→ Br∙g + H2Og k = 1.1 x 10⁻¹¹ cm3/molecule*s • Br∙g + O3g BrO∙g + O2 g • The value of k, combined with low [OH] makes this sequence too slow to explain BrO observations. Finlayson Pitts and Pitts, Chemistry of the Upper and Lower Atmosphere, 2000
Conversion of HBr to BrO: Heterogeneous reactions (3) BrO∙g +HO2∙g HOBrg + O2g (4) HOBrg HOBraq (5) HOBraq + HBraq Br2aq +H2Oaq (6) Br2aq Br2g (7) Br2g+ hv 2Br∙g (8) Br∙g + O3g BrO∙g + O2g • Net: HO2∙g+O3g+hv+HBrgH2Oaq+2O2g+Br∙g Reaction requires a surface (sulfate aerosols)!
Can field observations be replicated using a chemical model? 5 m/s plume speed • 1D model “MISTRA” (von Glasow, 2002) • Air parcel moves across volcano • Gas and aerosol chemistry (170 gas phase & 265 aqueous phase rxns) • Vertical and horizontal dilution 30 m 3340 m Bobrowski et al., GRL, 2007
Model input parameters • Initial plume: 78% H2O, 8.7% CO2, 2.6% SO2, 1.3% HCl, 0.006% HBr • Volcanic gas + atmospheric air mixture at thermodynamic equilibrium • Temperature 600 deg C • Equilibrium composition calculated at 10 s time intervals Bobrowski et al., GRL, 2007
BrO forms in volcanic plume Bobrowski et al., GRL, 2007
SO2: Plume diffusion tracer • SO2 concentration in plume decreases gradually as plume diffuses with time • BrO/SO2 plot reflects that BrO is affected by chemical reactions in addition to plume diffusion Bobrowski et al., GRL, 2007
Bromine activation (HBr Br BrO) BrO∙ Effects? HBr
O3 O2 Br • BrO• HO2• •OH hv HOBr O2 Br Ozone Destruction Cycle Net RXN: O3 + HO2 + hv 2O2 + OH von Glasow et al., Atmos. Chem. Phys. Discuss., 2004
CO + O2 CO2 O3 O2 Br • BrO• HO2• •OH hv HOBr O2 Br and HOx Catalytic Cycle Net RXN: CO + O3 CO2 + 2O2 von Glasow et al., Atmos. Chem. Phys. Discuss., 2004
Model shows inverse relationship between Ozone and BrO • 20 minutes following model initiation, O3 levels drop to near zero • At this time BrO levels begin to sharply increase • After 90 minutes O3 levels begin to increase as plume mixes with ambient air Bobrowski et al., GRL, 2007
Use chemical transport model MATCH-MPIC to test theory • 3D chemical transport model (MATCH-MPIC) to test impacts of BrO on O3 in the troposphere • Included comprehensive gas phase chemistry and HBr heterogeneous rxns • Global Br source of 60 - 120 molec*cm-3*s-1 • 4 scenarios different latitude and compositions vonGlasow et al., Atmos. Chem. Phys. Discuss., 2004
BrO depletes O3according to model results • BrO mixing ratios of < 2 pptv can result in: • 18% reduction in mean tropospheric O3 mixing ratios (large areas) • 40% reduction in mean tropospheric O3 mixing ratios (localized areas) vonGlasow et al., Atmos. Chem. Phys. Discuss., 2004
Do reactive halogens cause localized ozone holes near volcanoes?Case study: Sakurajima Volcano • BrO, ClO, and SO2 SCD were measured downwind of Sakurajima volcano • Direct SO2 and O3 also measured at Observatory • Strong correlation between BrO, ClO, and SO2 species http://landsat.usgs.gov/gallery/ Lee et al., GRL, 2005
Increase in SO2 corresponds with decrease in O3 Lee et al., GRL, 2005
Bromine activation (HBr Br BrO) Ozone depletion (O3 + HO2 + hv 2O2 + OH) BrO• HBr
Do large volcanic eruptions cause global stratospheric ozone depletion due to Br chemistry?
Kasatochi Volcanic Eruption August 2008 • Injected 1.5 Mt SO2 into atmosphere (Pinatubo 20 Mt) • Plume to 40,000 feet elevation (stratosphere for Kasatochi’s latitude) • SO2 cloud circled globe in 21 days • Using BrO/SO2 ratio of ~ 10-4 (Bobrowski et al., 2007) 150 t BrO injected into atmosphere Alaska Volcano Observatory, Internal Logs, August 2008; Photo by Chris Waythomas
Kasatochi SO2 CloudCircles Globe Image by Simon Carn, NASA JCET
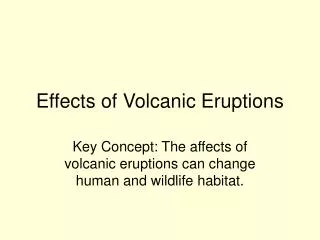
Conclusions • Volcanic bromine emissions account for a significant amount of total atmospheric Br • Volcanically emitted HBr can produce BrO via heterogeneous reactions on sulfate aerosols • BrO can catalytically react in an O3 destruction cycle • BrO in volcanic plumes may cause localized ozone holes Future Work Could large volcanic eruptions significantly deplete stratospheric ozone due to BrO chemistry?