Download
1 / 17
260 likes | 528 Views
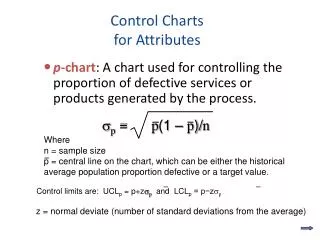
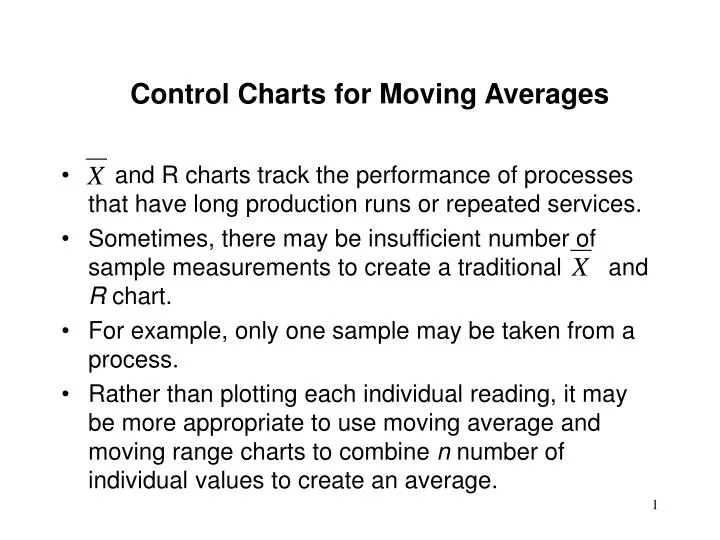
Control Charts for Moving Averages. and R charts track the performance of processes that have long production runs or repeated services. Sometimes, there may be insufficient number of sample measurements to create a traditional and R chart.

E N D
Control Charts for Moving Averages • and R charts track the performance of processes that have long production runs or repeated services. • Sometimes, there may be insufficient number of sample measurements to create a traditional and R chart. • For example, only one sample may be taken from a process. • Rather than plotting each individual reading, it may be more appropriate to use moving average and moving range charts to combine n number of individual values to create an average.
Control Charts for Moving Averages • When a new individual reading is taken, the oldest value forming the previous average is discarded. • The new reading is combined with the remaining values from the previous average to form a new average. • This is quite common in continuous process chemical industry, where only one reading is possible at a time.
Control Charts for Moving Averages • By combining individual values produced over time, moving averages smooth out short term variations and provide the trends in the data. • For this reason, moving average charts are frequently used for seasonal products.
Control Charts for Moving Averages • Interpretation: • a point outside control limits • interpretation is same as before - process is out of control • runs above or below the central line or control limits • interpretation is not the same as before - the successive points are not independent of one another
Example: Eighteen successive heats of a steel alloy are tested for RC hardness. The resulting data are shown below. Set up control limits for the moving-average and moving-range chart for a sample size of n=3. Heat Hardness Average Range Heat Hardness Average Range 1 0.806 10 0.809 2 0.814 11 0.808 3 0.810 12 0.810 4 0.820 13 0.812 5 0.819 14 0.810 6 0.815 15 0.809 7 0.817 16 0.807 8 0.810 17 0.807 9 0.811 18 0.800
Example: Eighteen successive heats of a steel alloy are tested for RC hardness. The resulting data are shown below. Set up control limits for the moving-average and moving-range chart for a sample size of n=3. Heat Hardness Average Range Heat Hardness Average Range 1 0.806 10 0.809 0.810 0.002 2 0.814 11 0.808 0.809 0.003 3 0.810 0.810 0.008 12 0.810 0.809 0.002 4 0.820 0.815 0.010 13 0.812 0.810 0.004 5 0.819 0.816 0.010 14 0.810 0.811 0.002 6 0.815 0.818 0.005 15 0.809 0.810 0.003 7 0.817 0.817 0.004 16 0.807 0.809 0.003 8 0.810 0.814 0.007 17 0.807 0.808 0.002 9 0.811 0.813 0.007 18 0.800 0.805 0.007
Exponentially Weighted Moving Average (EWMA) • The EWMA values are obtained as follows: • Control limits are set at Where
Chart with a Linear Trend • As the tool or die wears • a gradual change in the average is expected and considered to be normal • the measurement gradually increases • the R chart is likely to remain in control - the estimate of may not change. • The difference between upper and lower specifications limits is usually set substantially greater than 6 , to provide some margin of safety against the production of defective products
Chart with a Linear Trend Step 1: A trend line is obtained for the chart. A simplified formula is available if • there are an odd number of subgroups • subgroups are taken at a regular interval and • the origin is assumed at the middle subgroup
Chart with a Linear Trend Step 2: For each subgroup a separate pair of control limits is obtained above and below the trend line (so, the control limits are sloping lines parallel to the trend line)
Chart with a Linear Trend Step 3: Estimate . For k = 3, 4 etc. the initial aimed-at mean value, is set k above the lower specification limit and the process is stopped for readjustment (a new setup is made, tool/die is changed) when the observed mean value reaches k below the upper specification limit.
Text Problem 10.25: A certain manufacturing process has exhibited a linear increasing trend. Sample averages and ranges for the past 15 subgroups, taken every 15 minute in subgroup of 5 items, are given in the following table. Fit the linear trend line to these data, and plot a trended control chart with 3-sigma limits.
Text Problem 10.26: Specifications on the process in Problem 10.25 are 20030. The process may be stopped at any time and readjusted. If on readjustment the mean is to be set exactly 4 above the lower specification and the process is to be stopped for readjustment when the mean reaches a level exactly 4 below the upper specification: (a) Calculate the aimed-at starting and stopping values of (b) Estimate the duration of a run between adjustments
Reading and Exercises • Chapter 10 (moving average and linear trend): • pp. 382-391 (Sections 10.6-7) • 10.24, 10.27