Download
1 / 12
130 likes | 320 Views
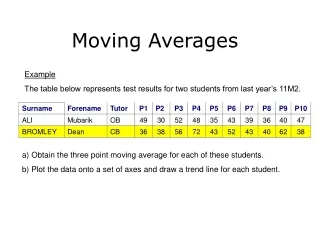
Moving Averages. Objectives: D Grade Interpret a Time Series Graph. B Grade Construct a Time Series Graph and Plot the Moving Averages. Title. Axis Labels. The points are plotted as coordinates. Moving Averages.

E N D
Moving Averages Objectives: D Grade Interpret a Time Series Graph B Grade Construct a Time Series Graph and Plot the Moving Averages
Title Axis Labels The points are plotted as coordinates Moving Averages A line graph is a series of points joined with straight lines e.g. a patient’s temperature was recorded every 2 hours after receiving medication: Note the features: What does this line represent? Normal body temperature The points are joined with straight lines A second set (or more) of data may be added to the graph.
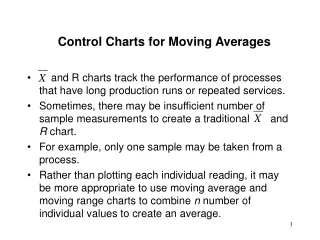
Moving Averages Because the line graph of temperature was plotted against time it can also be called a ‘Time Series Graph’ Time Series Graphs are often used by people to identify trends over a period of time where they may be natural fluctuations. For example, after installing loft and cavity wall insulation a householder wants to review his gas bills to see if he is saving money.
2006 2007 Moving Averages A graph of gas bills plotted against time. Why is there so much fluctuation in the graph – is there a pattern? Why is the x axis labelled with years and 1st, 2nd, 3rd, 4th? The 1st quarter is winter when you would expect to use a lot of gas for heating, the 3rd quarter is the summer when you don’t use the heating. Utility (gas, electric, water, etc.,) bills are sent out every 3 months (quarter of a year)
Moving Averages A different number of points for a moving average can be selected depending upon the data being analysed. Different types of data suit different moving averages Which type of moving average which suit which data set? Electricity Bill Three-point moving average Gas Bill Four-point moving average Half-term test results Five-point moving average Phone Bill Six-point moving average Daily Superstore Sales Seven-point moving average Termly test results
x x x Ice Cream Sales (£) x x x x x x x x x 2006 2007 2008 Moving Averages Time Series Graph Plot the data as a time series graph: This is essentially a line graph. The time is always plotted on the x-axis 1200 1000 800 600 400 200 4th Qtr 1st Qtr 2nd Qtr 2nd Qtr 2nd Qtr 3rd Qtr 1st Qtr 3rd Qtr 4thQtr 3rd Qtr 4th Qtr 1st Qtr
x x x x x Year 2006 2007 2008 Quarter 1st 2nd 3rd 4th 1st 2nd 3rd 4th 1st 2nd 3rd 4th Ice Cream Sales (£) 340 525 965 470 355 510 1100 375 410 555 1150 485 1 Moving Average x x x Ice Cream Sales (£) x x x x x x x x x x 2006 2008 2007 Representing Data Moving Averages Moving Averages are a way of looking at a trend over a period of time. For a four-point the mean is calculated from the first four pieces of data, then the next point is calculated by moving the selection one place across to calculate the mean of 4 points again Calculate the mean of the first 4 points i.e. 340+525+965+470 = 575 4 Calculate the mean of the second 4 points i.e. 525+965+470 +355= 579 4 575 Ice Cream Sales (£) 340 525 965 470 355 510 1100 375 410 555 1150 485 2 579 1200 Moving Average 575 575 609 585 599 610 623 The moving average point is plotted in the middle of the 4 points the average is taken from 1000 800 You can see there is a general increase in sales over time 600 x x 400 For a 3 point moving average take the mean over 3 points, for a 5 point moving average take the mean over 5 points, etc. 200 2nd Qtr 4th Qtr 1st Qtr 2nd Qtr 1st Qtr 2nd Qtr 3rd Qtr 3rd Qtr 3rd Qtr 4thQtr 1st Qtr 4th Qtr
Moving Averages P20 Q 5 P21 Q 6
Moving Averages P21 Q 7 P21 Q 8 120 100 80 60 40 20 0 x x x x Sales (£ thousands) x x x x Jul-05 Apr-05 Jan-05 Jul-04 Apr-06 Oct-04 Oct-05 Jan-05
Moving Averages P20 Q 5 £103.75 £110 £116.25 250 200 150 100 50 0 x x x x x x x x Cost (£) x x x x 1st 2nd 3rd 4th 1st 2nd 3rd 4th 2006 2007 Time (year, quarter) The trend is moving downwards which means that the electricity costs are falling
Moving Averages P21 Q 6 236 234.5 226 193 168.5 270 250 230 210 190 170 150 x x x x x x x x x x x Number Present x x x x x x x x Fri a.m. Mon p.m. Fri p.m. Tue p.m. Mon a.m. Tue a.m. Thu p.m. Thu a.m. Wed a.m. Wed p.m. The trend is downwards – starting low on Monday, then rising to Wednesday, but Falling sharply towards Friday.
Moving Averages 100 90 80 70 60 P21 Q 7 x x x x x x x x x x x x P21 Q 8 Spr-07 Aut-05 Aut-06 Aut-07 Spr-06 Sum-06 Sum-07 57.5 60 62.5 63 64.5 120 100 80 60 40 20 0 x c. The trend is slightly upwards x x d. The next point would probably lie at 67 x 67= 50+12+86 +x 4 Sales (£ thousands) x x x x x x x 67 × 4 = 50 + 10 + 86 + x x 268 = 146 + x x = 122 x x So the next quarter sales would be about £122 000 Jul-05 Apr-05 Jan-05 Jul-04 Apr-06 Oct-04 Oct-05 Jan-05