Download
1 / 60
600 likes | 609 Views
TRENDLINES AND MOVING AVERAGES TRENDLINES MOVING AVERAGES. TRENDLINES Technical analysis is built on the assumption that prices trend. TLs are an important tool in technical analysis for both trend identification and confirmation.

E N D
TRENDLINES AND MOVING AVERAGES TRENDLINES MOVING AVERAGES
TRENDLINES • Technical analysis is built on the assumption that prices trend. • TLs are an important tool in technical analysis for both trend identification and confirmation. • A TL is a straight line connects two or more price points. • And then extends into the future to act as a line of support or resistance. • Many of the principles applicable to support and resistance levels can be applied to TL’s as well. • An uptrend line has a positive slope and is formed by connecting two or more low points. • The second low must be higher than the first for the line to have a positive slope. • Up TL act as support and indicate that net-demand (demand less supply) is increasing even as the price rises. • A rising price combined with increasing demand is very bullish and shows a strong buyer determination. • As long as prices remain above the trend line, the uptrend is considered solid and intact. • A break below the up TL indicates that net-demand has weakened and a change in trend could be imminent. • A downtrend line has a negative slope and is formed by connecting two or more high points. • The second high must be lower than the first for the line to have a negative slope. • Downtrend lines act as resistance, and indicate that net-supply (supply less demand) is increasing despite fall • A declining price combined with increasing supply is very bearish and shows the strong resolve of the sellers. • As long as prices remain below the downtrend line, the downtrend is considered solid and intact. • A break above the down TL indicates that net-supply is decreasing and a change of trend could be imminent. • The more points used to draw the trend line, the more validity attached to the support or resistance levels. • Sometimes the lows or highs just don't match up, and it is best not to force the issue. • Two point confirm and the third point confirms the validity.
TRENDLINES • As the steepness of a trend line increases, the validity of the support or resistance level decreases. • A steep trend line results from a sharp advance (or decline) over a brief period of time. • The angle of a TL created from such sharp moves is unlikely to offer a meaningful support or resistance level. • Trading a trendline break has been found difficult. • Trend lines can offer great insight, but if used improperly, they can also produce false signals. • Other items - such as horizontal support and resistance levels or peak-and-trough analysis. • While trend lines are very popular, they are merely one tool for establishing, analyzing, and confirming a trend. • TL should not be the final arbiter, but should serve as a warning that a change in trend may be imminent. • By using TL breaks for warnings, traders can pay closer attention to other signals for a potential change.
TOOLS AND INDICATORS TRENDLINES
8 DAYS - 3% SPOT - 12% DERIVATIVES -136% SPOT ANNUALISED -547% DERIVATIVES ANNUALISED
GOLD. CYCLE AND PRIMARY CHANNELS COCOA. CYCLE AND PRIMARY CHANNELS
COFFEE. CYCLE AND PRIMARY CHANNELS COCOA. CYCLE AND PRIMARY CHANNELS
TRENDLINE SIGNIFICANCE. LONGER TIME. VOLUME VALIDATION. RECENT PRICE ACTION EVIDENCE OF A TREND P/I/M. 2 REACTION LOWWS - 3 TOUCH VALIDATES UP TLINE. SUPPORT USED AS DIPS TO LONG DOWN TLINE. RESISTANCE USED AS DIPS TO SHORT BREAK OF TLINE EARLY WARNING. ALL PRICE ACTION SHOULD BE ENCOMPASSED PENETRATIONS – MEANS PROPER CLOSE NOT A SPIKE. FILTER TIME 2 DAYS FILTER PRICE - 3%/1% - DEPENDING ON STRATEGY ROLE REVERSAL – CHANGING FROM A SUPPORT TO RESISTANCE HOW TO UNDERSTAND THE STEEPNESS OF A TLINE BEHAVIOUR AT RETURN LINE IS A WARNING ROUND NUMBERS/ AVOID PLACING ORDERS NEAR ROUND NUMBERS 3/900
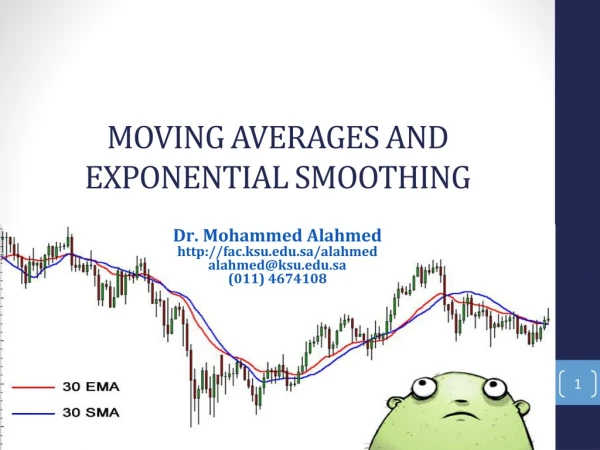
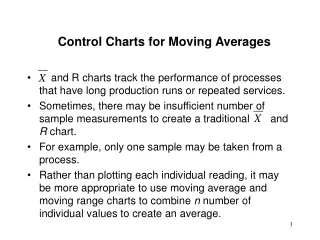
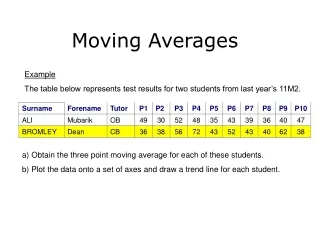
MOVING AVERAGE • Moving averages are one of the most popular and easy to use tools available. • They offer a trade off between sensitivity and reliability. The less • Shorter moving averages will be more sensitive and generate more signals. • There will also be an increase in the number of false signals and whipsaws. • Longer moving averages will move slower and generate fewer • signals. These signals will likely prove more reliable, but they also may come late. • Each trader should experiment with different moving average lengths and types to examine the trade-off • Moving averages smooth out a data series and make it easier to identify the direction of the trend. • Because past price data is used to form MA, they are considered lagging, or trend following, indicators. • Moving averages will not predict a change in trend, but rather follow behind the current trend. • Therefore, they are best suited for trend identification and trend following purposes, not for prediction. • Because moving averages follow the trend, they work best when a security is trending and not sideways. • Hence first identify securities that display some trending characteristics before attempting to use MA’s. • An uptrend is established when a security forms a series of higher highs and higher lows. • A downtrend is established when a security forms a series of lower lows and lower highs. • Or an uptrend is started when the upper boundary of the range is broken and vice versa.
USES • There are many uses for moving averages, mainly Trend identification/confirmation • Support and Resistance level identification/confirmation • Trading Systems • Trend Identification/Confirmation • Disadvantages of using moving averages need to be weighed against the disadvantages. • Moving averages are trend following, or lagging, indicators that will always be a step behind. • This is not necessarily a bad thing though. After all, the trend is your friend and it is best to trade • Markets, stocks and securities spend a great deal of time in trading ranges, which render moving averages ineffective. • Once in a trend, moving averages will keep you in, but also give late signals. • Don't expect to get out at the top and in at the bottom using moving averages. • As with most tools of technical analysis, moving averages should not be used on their own, but in conjunction • Using moving averages to confirm other indicators and analysis can greatly enhance technical analysis.
TOOLS AND INDICATORS MOVING AVERAGES
TOOLS AND INDICATORS MOVING AVERAGES CASE CONSTRUCTION INTERPRETATION SIGNALS WHIPSAWS AND COMPLEMENTING WITH OTHER TOOLS TIME FRAME REDUCTION. ADVANTAGES AND DISADVANTAGES NO OF SIGNALS AND QUALITY OF SIGNALS CROSSOVER. WHAT IS A CROSSOVER? WHY TO USE A CROSSOVER? INTERPRETATION SIGNALS
SUMMARY TREND FOLLOWING MECHANICAL SYSTEM CHOICE OF TOOL FOR AN INVESTOR NOT TO SAY EXTREMELY VALUABLE FOR A TRADER UNEQUIVOCAL. CLEAR SIGNAL. TIME LAG TREND FOLLOWING WHEN TREND CHANGES PRICE START MOVING SIDEWAYS AND THEN SYSTEM STARTS WHIPSAWING
SIF5 WEEKLY – MA CROSSOVER WHIPSAWS FOR 2 WEEKS BUT REMAINS POSITIVE