Download
1 / 1
10 likes | 142 Views
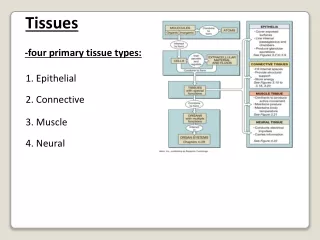
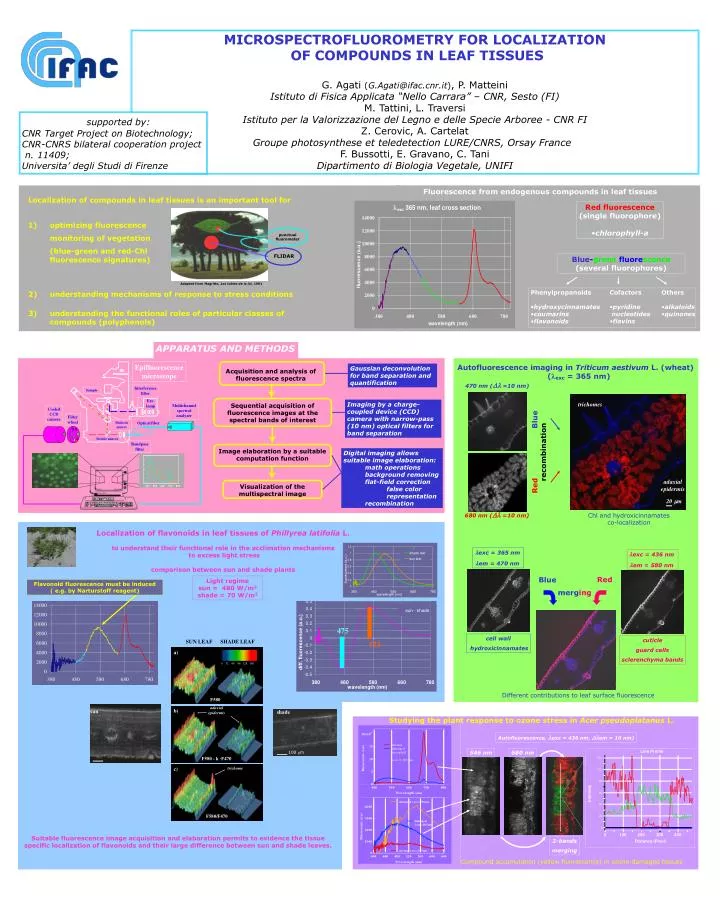
SUN LEAF SHADE LEAF. Epifluorescence microscope. a). Gaussian deconvolution for band separation and quantification. 0 32 64 96 128 160. Acquisition and analysis of fluorescence spectra. 546 nm. 680 nm. Interference filter. Sample. trichomes. Exc. lamp.

E N D
SUN LEAF SHADE LEAF Epifluorescence microscope a) Gaussian deconvolution for band separation and quantification 0 32 64 96 128 160 Acquisition and analysis of fluorescence spectra 546 nm 680 nm Interference filter Sample trichomes Exc. lamp Multichannel spectral analyzer F580 Cooled CCD camera sun Imaging by a charge-coupled device (CCD) camera with narrow-pass (10 nm) optical filters for band separation shade Sequential acquisition of fluorescence images at the spectral bands of interest adaxial epidermis b) Filter wheel Dichroic mirror Opticalfiber Line Profile 120 Mobile mirror Bandpass filter 100 475 80 F580 - k ·F470 Image elaboration by a suitable computation function Digital imaging allows suitable image elaboration: math operations background removing flat-field correction false color representation recombination 575 c) trichome 60 Intensity adaxial epidermis 40 20 20 mm 0 Visualization of the multispectral image 0 100 200 400 300 Distance (Pixel) F580/F470 Fluorescence from endogenous compounds in leaf tissues • Redfluorescence • (single fluorophore) • chlorophyll-a Blue-greenfluorescence (several fluorophores) • Phenylpropanoids • hydroxycinnamates • coumarins • flavonoids • Cofactors • pyridine • nucleotides • flavins • Others • alkaloids • quinones Autofluorescence imaging in Triticum aestivum L.(wheat) (lexc = 365 nm) 470 nm (Dl=10 nm) 680 nm (Dl =10 nm) lexc = 365 nm lem = 470 nm lexc = 436 nm lem = 580 nm Blue merging Red cell wall hydroxicinnamates cuticle guard cells sclerenchyma bands MICROSPECTROFLUOROMETRY FOR LOCALIZATION OF COMPOUNDS IN LEAF TISSUES G. Agati (G.Agati@ifac.cnr.it), P. Matteini Istituto di Fisica Applicata “Nello Carrara” – CNR, Sesto (FI) M. Tattini, L. Traversi Istituto per la Valorizzazione del Legno e delle Specie Arboree - CNR FI Z. Cerovic, A. Cartelat Groupe photosynthese et teledetection LURE/CNRS, Orsay France F. Bussotti, E. Gravano, C. Tani Dipartimento di Biologia Vegetale, UNIFI supported by: CNR Target Project on Biotechnology; CNR-CNRS bilateral cooperation project n. 11409; Universita’ degli Studi di Firenze Localization of compounds in leaf tissues is an important tool for 1) optimizing fluorescence monitoring of vegetation (blue-green and red-Chl fluorescence signatures) punctual fluorometer FLIDAR Adapted from Magritte, Les tables de la loi, 1961 2) understanding mechanisms of response to stress conditions 3) understanding the functional roles of particular classes of compounds (polyphenols) APPARATUS AND METHODS Red Blue recombination Chl and hydroxicinnamates co-localization Localization of flavonoids in leaf tissues of Phillyrea latifolia L. to understand their functional role in the acclimation mechanisms to excess light stress comparison between sun and shade plants Light regime sun = 480 W/m2 shade = 70 W/m2 Flavonoid fluorescence must be induced ( e.g. by Narturstoff reagent) Different contributions to leaf surface fluorescence Studying the plant response to ozone stress in Acer pseudoplatanus L. Autofluorescence, lexc = 436 nm, Dlem = 10 nm) 100 mm Suitable fluorescence image acquisition and elaboration permits to evidence the tissue specific localization of flavonoids and their large difference between sun and shade leaves. 2-bands merging Compound accumulation (yellow fluorescence) in ozone-damaged tissues