Download
1 / 71
710 likes | 832 Views
Putting It All Together Training August 18, 2009. SIP. ODMS. PD. School Name (and motto or theme). Objectives. Part One – Reflection Part Two – Grading, AYP and Data Analysis Part Three – School Improvement Planning Part Four – Development of IPDP’s

E N D
Putting It All Together TrainingAugust 18, 2009 SIP ODMS PD School Name (and motto or theme)
Objectives • Part One – Reflection • Part Two – Grading, AYP and Data Analysis • Part Three – School Improvement Planning • Part Four – Development of IPDP’s • Part Five – School Professional Development Plans
Part One REFLECTIONS REFLECTIONS
Celebration Activity In your small group, fill out the Celebrating Our Success sheet. • In the first column list our areas of “SUCCESS”. • In the second column, list “WHY” this success occurred. What factors contributed to the success? • In the third column, write one to three “NEXT STEPS” needed to expand or sustain that success. • Be prepared to share your answers with the larger group.
Celebrating Our Success Success Why Next Steps
Mission District Mission – School Mission –
Processing Pause Are we “living” our vision and mission? What does it: “look like” “sound like” “feel like” at our school?
Vision and Mission Reflection Activity • As a group, reflect on what our vision and mission: “looks like” “sounds like” “feels like” • Record your responses on the Vision and Mission Reflections chart. • Be prepared to share with the larger group.
Vision And Mission Reflections Looks Like Sounds Like Feels Like
Part Two School Grading and AYP 2008 – 2009 School Data Analysis
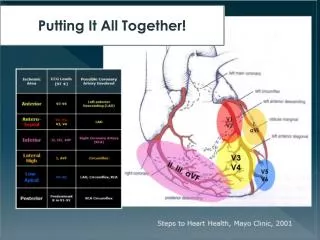
Sometimes The Data Is Confusing… Why are the Level 3 and above scores different from the State Grade and AYP?
Student Population Vocabulary Check • Standard Curriculum for School Grade(Proficient on high standards) • All Curriculum for School Grade(Annual Learning gains) • All Curriculum for Adequate Yearly Progress (AYP)
Standard Curriculum Students for School Grade • Used to calculate high standards/proficiency • Reading, math, and science – Level 3 or above • Writing – Level 3.5 or above • All regular curriculum students • Speech-impaired, gifted, hospital/homebound • ELL students with more than 2 years in an ESOL program • Students in the same school in both October and February Excludes – • ELL less than 2 years ** • Students with Disabilities **
All Curriculum Students for School Grade • Used to calculate learning gains • All regular curriculum students • Speech impaired, gifted, hospital/homebound • ELL • More than 2 years • Less than 2 years if they took the test the prior year for baseline data • Does NOT include students less than 1 year • All students with disabilities (except those participating in the Alternative Assessment) • Students in the same school in both October and February
All Curriculum Students for AYP • Same as all curriculum students for learning gains • Includes alternative assessment
So What Does All This Mean? When you look at your objectives and ask, “Did we make progress?” -- make sure you are comparing data from the same population-type of students. Standard Curriculum 2008 = Standard Curriculum 2009 All Curriculum 2008 = All Curriculum 2009 =
School Grading System • Based on Three Categories: • Total Points • Adequate Progress/Learning Gains • % of Students Tested
2009 School Grading System • Awarded one (1) point for each percentage of students meeting high standards • Reading, math, science ( a Level 3 or above) • Writing (3.5 or above) • Awarded one (1) point for each percentage of students making learning gains (adequate progress) in reading and math • Awarded one (1) point for each percentage of the lowest performing students making learning gains (adequate progress) in reading and math
Grading Components (cont.) • If a school, otherwise graded “A”, does not demonstrate adequate progress in the current year, the final grade will be reduced by one letter grade. • If a school, otherwise graded “B” or “C”, does not demonstrate adequate progress in either the current or prior year, the final grade will be reduced by one letter grade.
How Do You Make Learning Gains? Students can demonstrate learning gains in any one of three (3) ways: • Improve achievement levels from 1-2, 2-3, 3-4, 4-5 or • Maintain within the relatively high levels of 3, 4, or 5 or • Maintain an achievement level of 1 or 2 and demonstrate one year’s growth – which is to exceed the Developmental Scale Scores (DSS) cut score** for their particular grade level. This does not include retained students.
Adequate Progress (Annual Learning Gains on SSS) Adequate Yearly Progress (AYP – Determined by Set Benchmark) ≠
Annual Learning Gains = Individual Student Data Adequate Yearly Progress = Whole School Data
Additional Grading CriteriaFor Calculating “Adequate Progress” • If the lowest 25% do not make learning gains (min. 50%) for two consecutive years the school will lose a letter grade. • At least 40% in reading and math, if they show improvement from the prior year. • Less than 40%, if at least a five percentage point improvement from the prior year
2008-2009 School Grade Add your own data/celebrate
2008-2009 State Report Card/School Grade Data Source School “ ” = Not Applicable Cell A=525 B=495 C=435 D=395 F=394 Total Points = / ODMS Report SIP0010 Exercise #1
Grade Level Data: High Standards Data Source School Name ODMS Report SIP0020 Exercise #2
Grade Level Data: High Standards Exercise #2
Grade Level Data: Percent Making Annual Gains Data Source School Name ODMS Report SIP0020 Exercise #3
Grade Level Data: Percent Making Annual Gains Exercise #3
Grade Level Data: Lowest Quartile Making Annual Gains Data Source Data Source School Name ODMS Report SIP0020 Exercise #4
Grade Level Data: Lowest Quartile Making Annual Gains Exercise #4
Subgroup Data: Percent Making Annual Gains Data Source School Name ODMS Report SIP0050 Exercise #5
Transition Time . . . • Up until this point you have been working with School Grade Data from Standard Curriculum data. • The next few slides will look at performance data by achievement levels using All Curriculum Data.
Reading Achievement Level Comparisons By Grade Level Data Source ODMS Report DEM0030 Exercise #6
Reading Achievement Level Comparisons By Grade Level Exercise #6
Math Achievement Level Comparisons – Overall Data Source ODMS Report DEM0030 Exercise #7
Math Achievement Level Comparisons - Overall Exercise #7
Achievement Level Comparisons – Overall Data Source To Access Achievement Level Comparisons By School, Grade And Year 1. Go to: http://fcat.fldoe.org/results/default.asp 2. Check the appropriate boxes and click ‘Continue’. Report LEVEL COUNTY SUBJECT(S) YEAR(S) GRADE(S) Exercise #8 CONTINUE
Achievement Level Comparisons - Overall Exercise #8
Achievement Level Comparisons – Overall Data Source To Access Achievement Level Comparisons By School, Grade And Year 1. Go to: http://fcat.fldoe.org/results/default.asp 2. Check the appropriate boxes and click ‘Continue’. Report LEVEL COUNTY SUBJECT(S) YEAR(S) GRADE(S) Exercise #9 CONTINUE
FCAT Writing ODMS Report SIP0030 Exercise #9
Processing Pause Take 3-5 minutes to individually process the data and information reviewed up to this point. As a small group, record the strengths/successes and areas needing attention observed from the data. Record the information on the 2008-2009 Data Observations sheet in reflection table #1. Be prepared to share your answers with the larger group.
Time For A Review… • Adequate Progress/Learning Gains • Individual student data • Improve achievement levels from 1-2, 2-3, 3-4, 4-5 or • Maintain within the relatively high levels of 3, 4, or 5 or • Maintain an achievement level of 1 or 2 and demonstrate one year’s growth – which is to exceed the Developmental Scale Scores (DSS) cut score for their particular grade level. • Adequate Yearly Progress (AYP) • Whole school data • Each subgroup must meet annual AYP Benchmark in reading and math
Adequate Yearly Progress And School Grades Presented by: Research, Evaluation and Accountability
AYP What Is It?
A Brief History √ NCLB was signed into law by President George W. Bush on January 8, 2002. √ Requires each state to make Adequate Yearly Progress towards state proficiency goals. √ All students must be included in the determination of AYP. √ AYP measures the performance AND participation of various subgroups. √ The goal of NCLB is to have 100 % of students proficient by 2013-14.
Summary Of AYP Computations √ All schools must be held to the same criteria. √ All students must be included. √ AYP is based upon results of 5 racial/ethnic groups, plus, Economically Disadvantaged, Limited English Proficient (ELL) and Students With Disabilities (SWD) for a total of 8 subgroups. √ Subgroups must be larger than 30 students, represent 15 percent of the school’s population (in tested grades) or at least 100 students.