Download
1 / 22
220 likes | 354 Views
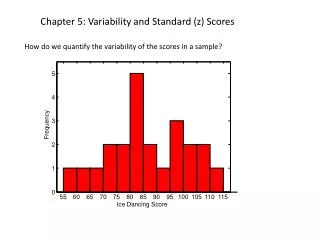
Chapter 5 Normal Curve and Standard Scores . James A. Van Slyke Azusa Pacific University . Frequency Distributions Graphs. Histograms Vertical bars above each score Height of bar corresponds to Frequency Width extends to real limits of the score Bar graphs

E N D
Chapter 5 Normal Curve and Standard Scores James A. Van Slyke Azusa Pacific University
Frequency Distributions Graphs • Histograms • Vertical bars above each score • Height of bar corresponds to Frequency • Width extends to real limits of the score • Bar graphs • Vertical bars above each score with space between each bar • Designates separate distinct categories
Histogram Frequency
Bar graph Frequency
DISTRIBUTIONS AND GRAPHS • Frequency Distribution Polygon (line graph) • A dot is centered above the score w/ height corresponding to frequency • Connected with a continuous line
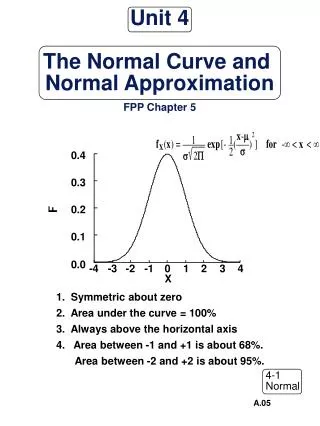
DISTRIBUTIONS AND GRAPHS • Normal Curve • Symmetrical – when folded, the two sides match • “Bell-shaped Curve”
Symmetrical Distribution Frequency
Skewed • Skewed – When folded the curve does not match • Positive skew – Most scores occur at the lower values of the horizontal axis • Negative skew – Most scores occur at the higher end of the horizontal axis
Positive Skew Frequency
Negative Skew Frequency
Measuring Central Tendency • If a particular distribution is unimodal and symmetrical • Mean, median, and mode are equal • bell-shaped curve; normal curve • Skewed distribution • Mean and median are not equal • Positive – mean larger than the median • Negative – mean is smaller than the median
Properties of the Normal Curve • Midpoint is mean, median and mode • Inflection points • One on each side of the mean • Notes where the curve changes direction • The inflection points are one standard deviation from the mean
Properties of the Normal Curve • In a normal curve • 34.13% of the scores are within the area between the mean and the score at one standard deviation • 13.59% of the scores lie between one and 2 standard deviations • 2.15% of the scores lie between two and three standard deviations • The same is true going in the negative direction
Standard or z scores • The transformation of a raw score into a score that reflects it’s relationship to the mean • This score designates how many standard deviations a particular score is above or below the mean • This process is referred to as score transformation
Standard or z scores • In equation form, a z score is calculated by:
Standard Scores • Allow us to know either the percentage of scores above and below a particular score • Allows us to transform two sets of scores into the same comparable scores
Z scores • Scores have the same shape as the raw scores • The mean of z scores always equals zero • The standard deviation of z scores always equals one
Converting Z score • Convert a z score into a percentage • Draw a diagram of the score on a z curve • consult the chart in appendix D, pg. 552 • Solve for the Area • May be used to find percentage between two scores • Also locate percentage above or below a certain score
Raw Scores from z scores • Find the raw score associated with a z score • Raw score associated with a z of .52
Homework • Chapter 5 • Page 110 – 8,11,12,16,17