Download
1 / 18
200 likes | 586 Views
Standard Scores and The Normal Curve. Z-Score. Just like percentiles have a known basis of comparison (range 0 to 100 with 50 in the middle), so does the z-score . Z-scores are centered around 0 and indicate how many standard deviations the raw score is from the mean.

E N D
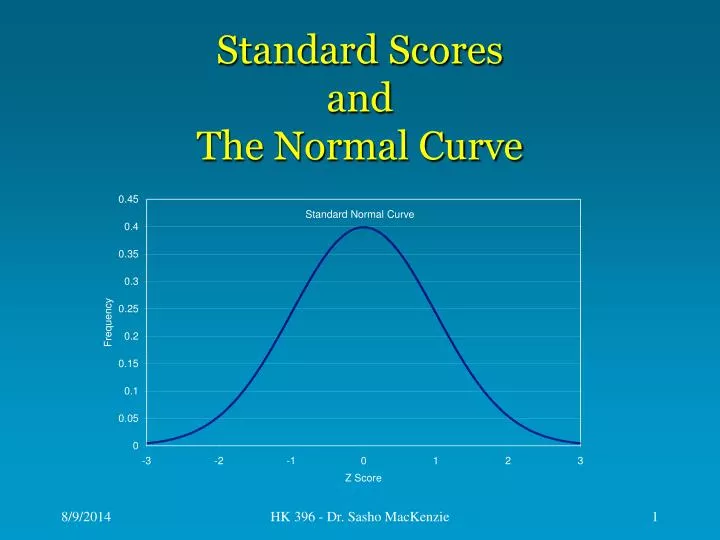
Standard ScoresandThe Normal Curve HK 396 - Dr. Sasho MacKenzie
Z-Score • Just like percentiles have a known basis of comparison (range 0 to 100 with 50 in the middle), so does the z-score. • Z-scores are centered around 0 and indicate how many standard deviations the raw score is from the mean. • Z-scores are calculated by subtracting the population mean from the raw score and dividing by the population standard deviation. HK 396 - Dr. Sasho MacKenzie
Z-score Equation • x is a raw score to be standardized • σ is the standard deviation of the population • μ is the mean of the population HK 396 - Dr. Sasho MacKenzie
Z-score for 300lb Squat • Assume a population of weight lifters had a mean squat of 295 ± 19.7 lbs. • That means that a squat of 300 lb is .25 standard deviation above the mean. This would be equivalent to the 60th percentile. HK 396 - Dr. Sasho MacKenzie
What about a 335 lb Squat • How many standard deviation is a 335 lb squat above the mean? • That means that a squat of 335 lb is 2 standard deviation above the mean. This would be equivalent to the 97.7th percentile. HK 396 - Dr. Sasho MacKenzie
From z-score to raw score • A squat that is 1 standard deviation below the mean (-1 z-score) would have a raw score of? • What would you know about the raw score if it had a z-score of 0 (zero)? HK 396 - Dr. Sasho MacKenzie
Z-score for 10.0 s 100 m • Assume a population of sprinters had a mean 100 m time of 11.4 ± 0.5 s. • That means that a sprint time of 10 s is 2.8 standard deviations below the mean. This would be equivalent to the 99.7th percentile. HK 396 - Dr. Sasho MacKenzie
Converting Z-scores to Percentiles • The cumulative area under the standard normal curve at a particular z-score is equal to that score’s percentile. • The total area under the standard normal curve is 1. HK 396 - Dr. Sasho MacKenzie
300 250 200 150 100 50 0 Histogram of Male 100 m 300 250 250 Frequency 150 150 50 50 <10.0 10.1 to 10.5 10.6 to 11.0 11.1 to 11.5 11.6 to 12.0 12.1 to 12.6 >12.7 Time (s) HK 396 - Dr. Sasho MacKenzie
The Histogram • Each bar in the histogram represents a range of sprint times. • The height of each bar represents the number of sprinters in that range. • We can add the numbers in each bar moving from left to right to determine the number of sprinters that have run faster than the current point on the x-axis. • Dividing by the total number of sprinters yields the proportion of sprinters that have run faster. HK 396 - Dr. Sasho MacKenzie
Proportion • For example, 50 sprinters ran less than 10.0 s. • That means that, (50/1200)*100 = 4%, of the sprinter ran < 10.0 s. • Notice that the area of each bar reflects the number of scores in that range. Therefore, we could just look at the amount of area. • If there are a sufficient number of scores, the bars can be replaced by a smooth line. HK 396 - Dr. Sasho MacKenzie
300 250 200 150 100 50 0 10.6 12.6 9.8 10.2 11.0 11.4 11.8 12.2 13.0 Time (s) Male NCAA 100 m Sprint 300 250 250 Frequency 150 150 50 50 HK 396 - Dr. Sasho MacKenzie
300 250 200 150 100 50 0 10.6 12.6 9.8 10.2 11.0 11.4 11.8 12.2 13.0 Time (s) 97 90 84 70 50 30 16 10 3 Percentile Male NCAA 100 m Sprint Frequency HK 396 - Dr. Sasho MacKenzie
Normal Distribution • If the data are normally distributed, then the raw scores can be converted into z-scores. • This yields a standard normal curve with a mean of zero instead of 11.4 s. HK 396 - Dr. Sasho MacKenzie
Male NCAA 100 m Sprint Frequency -3 -2 -1 0 1 3 2 z-score (standard deviations) HK 396 - Dr. Sasho MacKenzie
Male NCAA 100 m Sprint 50% 15.9% 84.1% Cumulative % Frequency 34.1% 34.1% 2.3% 97.7% 13.6% 13.6% 99.9% 0.14% 2.2% 2.2% -3 -2 -1 0 1 3 2 z-score (standard deviations) 0.1% 0.1% HK 396 - Dr. Sasho MacKenzie
Excel • The function NORMSDIST() calculates the cumulative area under the standard normal curve. • The function NORMSINV() performs the opposite calculation and reports the z-score for a given proportion. • NORMDIST() and NORMINV() perform the same calculations for scores that have not been standardized. HK 396 - Dr. Sasho MacKenzie
Z-score and Percentile Agreement • Converting a z-score to a percentage will yield that score’s percentile. • However, the population must be normally distributed. • The less normal the population the greater discrepancy between the converted z-score and the percentile. HK 396 - Dr. Sasho MacKenzie