Download

1 / 13
130 likes | 226 Views
Standardizing and the Standard Normal Curve. AP Statistics. The Standardized Value (the Z score). If x is an observation from a distribution that has mean and standard deviation , the standardized value of x is. A woman 68 inches tall for example has a standardized height of

E N D
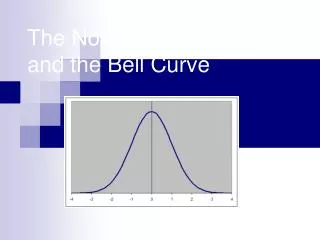
Standardizing and the Standard Normal Curve AP Statistics
The Standardized Value (the Z score) • If x is an observation from a distribution that has mean and standard deviation , the standardized value of x is
A woman 68 inches tall for example has a standardized height of this means that the woman is 1.4 standard deviations from the mean. Example 2.4 p. 94The heights of young women are approximately normal with mean =64.5 inches =2.5 inches.
Now, another woman is 5 feet (60 inches tall). The standardized height of this girl is this means that the woman is 1.8 standard deviations less than the mean height. The heights of young women are approximately normal with mean =64.5 inches =2.5 inches.
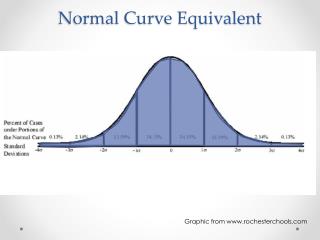
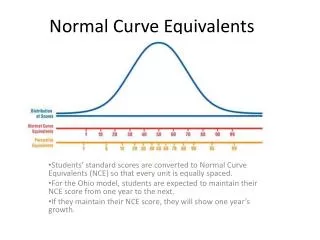
The Standard Normal Distribution • The Standard Normal Distribution is the normal distribution N(0,1) with mean 0 and standard deviation 1. • If a variable x has any normal distribution N( , ) with mean and standard deviation , then the standardized variable • has the standard normal distribution.
Table A is a table for the areas under the standard normal curve. The table entry for each value of z is the area under the curve to the left of z
Finding Normal Proportions • Step 1: State the problem in terms of the observed value x. Draw a picture of the distribution and shade the area of interest under the curve.Step 2: Standardize x to restate the problem in terms of a standard normal variable z. Draw a picture to show the area of interest under the standard normal curve.Step 3: Find the required area under the standard normal curve, using table A and the fact that the total area under the curve is 1Step 4: Writ your conclusion in the context of the problem
If we want the probability that x is less than a number, then it is written Look up your z score on table A at this point Example say that the distribution of the weights of dogs is N(25, 10) and we want the probability that a dog weighs less than 15 pounds. then… Now look up -1 on table A and you will see that the probability is 0.1587 The Dummy Rules: Dummy Rule 1
If we want the probability that x is greater than a number, then it is written Look up your z score on table A at this point Example say that the distribution of the weights of dogs is N(25, 10) and we want the probability that a dog weighs more than 30. then… Now look up 0.5 on table A and you will see that the probability is 0.6915 The Dummy Rules: Dummy Rule 2
If we want the probability that x is in between two numbers, then it is written (Let our numbers be represented by A and B) Look up both your z score on table A and subtract Example say that the distribution of the weights of dogs is N(25, 10) and we want the probability that a dog weighs less than 30 but more than 2. then… Now look up 0.5 and -2.3 on table A then subtract 0.6915 – 0.0107 = 0.6808 So the probability that a dog weighs less than 30 but more than 2 is 0.6808 The Dummy Rules: Dummy rule 3
Example 2.9 Working with an intervalThe distribution of blood cholesterol levels is roughly normal for 14-year old boys with mean =170 and =30 • What percent of 14-year old boys have blood cholesterol between 170 and 240? • Step 1: State the problem: We want the proportion of boys with..
Continued Example 2.9 Working with an intervalThe distribution of blood cholesterol levels is roughly normal for 14-year old boys with mean =170 and =30 • Step 2: Standardize and draw a picture.
Step 3: Use the table: Look up 2.33 and 0 on the table: Step 4: State your conclusion in context. About 49% of boys have cholesterol levels between 170 and 240 mg/dl. Continued Example 2.9 Working with an intervalThe distribution of blood cholesterol levels is roughly normal for 14-year old boys with mean =170 and =30