Download
1 / 46
480 likes | 651 Views
Measuring the Occurrence of Disease 2. Sue Lindsay, Ph.D., MSW, MPH Division of Epidemiology and Biostatistics Institute for Public Health San Diego State University. Measures of Mortality. Annual Mortality Rate Case Fatality Rate Proportionate Mortality

E N D
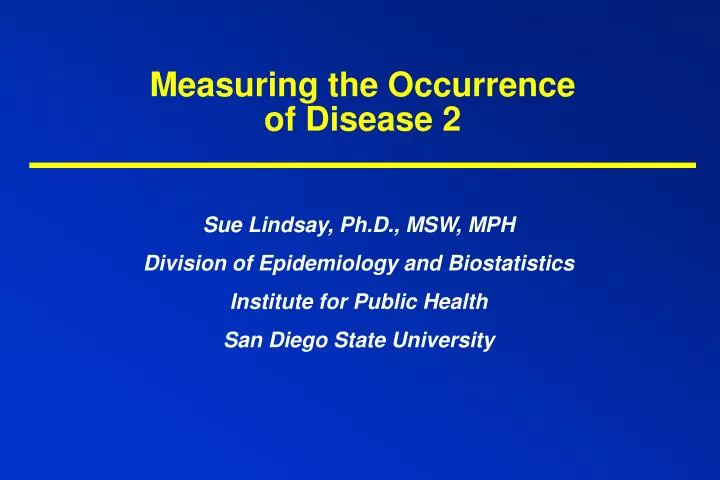
Measuring the Occurrence of Disease 2 Sue Lindsay, Ph.D., MSW, MPH Division of Epidemiology and Biostatistics Institute for Public Health San Diego State University
Measures of Mortality • Annual Mortality Rate • Case Fatality Rate • Proportionate Mortality • Years of Potential Life Lost
Types of Mortality Rates • Crude Rates • Specific Rates • Adjusted Rates
Annual All Cause Mortality Rate Total No. of Deaths From All Causes in 1 Year Annual Rate Per 1,000 = No. of Persons in the Population at Midyear
Age-Specific Mortality Rate Total No. of Deaths From All Causes in 1 Year In Children Younger Than 10 Years Annual Rate Per 1,000 in Children < 10 yrs. = No. of Children in the Population Younger Than 10 Years at Midyear
Disease-Specific Mortality Rate Total No. of Deaths From Lung Cancer in 1 Year Annual Rate From Lung Cancer Per 1,000 = No. of Persons in the Population at Midyear
Disease and age-specific mortality rate Total No. of Deaths From Leukemiain 1 Year In Children Younger Than 10 Years Annual Rate From Leukemia Per 1,000 in Children < 10 yrs. = No. of Children in the Population Younger Than 10 Years at Midyear
Disease Specific Mortality Rates: Important Concepts • The denominator equals the number of people at risk of dying. Any person counted in the denominator must be at risk of becoming a death in the numerator • The time period is arbitrary but must be specified (most often annual) • A good index of disease severity • Can be used as a measure of the risk of disease and can approximate incidence rates • When the case fatality rate is high • Duration of the disease is short
The Case-Fatality Rate No. of Persons Dying Of Disease After Disease Onset Case- Fatality Rate = No. of Persons With The Disease During a Specified Period of Time
Case-Fatality Rate: Important Concepts • Measures the severity of disease • Most commonly used in infectious diseases • The denominator is limited to persons who already have the disease
Proportionate Mortality No. of Deaths From a Specific Cause in 1 Year = PM Total Deaths in the Population in 1 Year
Proportionate Mortality: Important Concepts • Usually expressed as a percentage • Percentage of deaths from heart disease • Provides a quick look at major causes of death • Does not yield the risk of dying - Mortality rates provide this
Years of Potential Life Lost (YPLL) • Death at younger ages is associated with greater loss of future productive years of life • Used as an alternative measure of the burden of disease
Problems With Mortality Data • Information from death certificates may not be accurate • Quality varies • Primary and secondary causes of death • Changes in disease coding and definition will impact mortality rates • Validity may be disease specific
Age Adjustment • Age is one of the main determinants of disease onset and mortality • The age distribution of a population will influence the total mortality rate and often influence the incidence rate of disease • Age adjusted mortality rates correct for differences in age distribution in a population
Age Adjustment Methods • Direct Age Adjustment • Uses the age-specific mortality rates of each population of interest and the age distribution of a “standard” population • Indirect Age Adjustment • Uses the age-specific mortality rate of a “standard” population and calculates a Standardized Mortality Ratio (SMR)
Age-Adjustment Example Crude Mortality Rates in Alaska and Florida Florida Alaska Number of Deaths Total Population Crude Mortality Rate 131,044 12,335,000 1,062.4 per 100,000 2,064 524,000 393.9 per 100,000 Source: Vital Statistics of the U.S. (1991)
Percentage Distribution ofAge Groups in Florida andAlaska Populations, 1988 Percentage of Total Age
Age Adjustment: Direct Method • Select a standard population (choice is arbitrary) • U.S. 1988 Total US Population • Apply the age-specific mortality rates of both Florida and Alaska to the standard population distribution to calculate the expected number of deaths that would occur in each age group in the standard population • Sum the expected number of deaths over all age groups. Calculate the overall age-adjusted mortality rate for both Florida and Alaska.
Florida: Direct Method U.S. Population (standard) Florida Age-Specific Death Rate/ 100,000 Age Group Calculation of Expected Deaths Expected Deaths <5 5-19 20-44 45-64 >65 284 57 198 815 4425 18,300,000 52,900,000 98,100,000 46,000,000 30,400,000 .00284X18,300,000= .00057X52,900,000= .00198X98,100,000= .00815X46,000,000= .04425X30,400,000= 51,972 30,153 194,238 374,900 1,345,200 245,700,000 1,996,463 1,996,463 Age Adjusted Death Rate = =812.6 per 100,000 245,700,000
Alaska: Direct Method Alaska Age-Specific Death Rate/ 100,000 Age Group U.S. Population (standard) Calculation of Expected Deaths Expected Deaths <5 5-19 20-44 45-64 >65 274 65 188 629 4350 18,300,000 52,900,000 98,100,000 46,000,000 30,400,000 .00274X18,300,000= .00065X52,900,000= .00188X98,100,000= .00629X46,000,000= .04350X30,400,000= 50,142 34,385 184,428 289,340 1,322,400 245,700,000 1,880,695 1,880,695 Age Adjusted Death Rate = = 765.4 per 100,000 245,700,000
Age-Adjustment Example: Direct Method Florida Alaska Crude Mortality Rate Age Adjusted Mortality Rate 1,062.4/100,000 812.6/100,000 393.9/100,000 765.4/100,000
Age Adjustment: Indirect Method • Select a standard population (choice is arbitrary) • U.S. 1988 Total US Population • Apply the age-specific mortality rates of the standard population to the age distributions of Alaska and Florida to calculate the total expected deaths in each age group if they were subjected to the mortality experience of the standard population. Sum expected deaths over all age groups. • Calculate Standardized Mortality Ratio (SMR)
Standardized Mortality Ratio (SMR) Total Observed Deaths in the Population Total Expected Deaths in the Population SMR = IF SMR=1: Observed mortality is the same as expected mortality If SMR >1: Mortality is higher than expected. IF SMR<1: Mortality is lower than expected.
Florida: Indirect Method U.S. Death Rate/ 100,000 (standard) Expected Deaths Age Group Calculation of Expected Deaths Florida Population <5 5-19 20-44 45-64 >65 251.1 47.2 161.8 841.9 5,104.8 850,000 2,280,000 4,410,000 2,600,000 2,200,000 .00251X850,000= .000472X2,280,000= .001618X4,410,000= .008419X2,600,000= .051048X2,200,000= 2,134 1,076 7,135 21,889 112,305 144,539 Observed 131,044 SMR = = = 0.91 Expected 144,539
Alaska: Indirect Method U.S. Death Rate/ 100,000 (standard) Expected Deaths Calculation of Expected Deaths Alaska Population Age Group <5 5-19 20-44 45-64 >65 251.1 47.2 161.8 841.9 5,104.8 60,000 130,000 240,000 80,000 20,000 .00251X60,000= .000472X130,000= .001618X240,000= .008419X80,000= .051048X20,000= 151 61 388 674 1,021 2,295 Observed 2,064 SMR = = = 0.90 Expected 2,295
Age-Adjustment Example: Indirect Direct Florida Alaska Crude Mortality Rate Standardized Mortality Ratio 1,062.4/100,000 0.91 393.9/100,000 0.90
Age-Adjustment: Important Concepts • Both methods depend on the choice of the standard population • Standard populations can be: • Independent of either study population, a combination of the two populations, the larger of the two populations, etc. • Age-adjusted rates (direct method) are not “real”. It is important to know the population that was used as the standard. • SMR (indirect method) is a ratio not a rate. It gives only relative information and does not describe the mortality of the population.
Age-Adjustment: Important Concepts • Direct method uses age-specific death rates. Requires that this detailed information be known • Indirect methods are used if age-specific rates are unstable or unknown • Both methods can be used for other types of rates: i.e. incidence • Do not confuse with multivariate “adjustment for age”
Measurement • Quality of measurement is often the weakest and least considered area of study design • Don’t make this mistake! • Poorly designed or executed measures can effect the interpretation of your study! • You can get the wrong answer!
How do we measure? • Self-report • Historical documentation (medical records) • Direct observation • Direct examination • Specimen collection and measurement
Why do we measure? • Characterize patients at baseline • Determine eligibility for the study • To stratify or randomize • To assess similarity of comparison groups • To assess risk factors, protective factors and outcomes
What can be measured? • Demographics • History: symptoms, diagnosis, exposures • Disease state: physical exam, imaging, autopsy • Analysis of body fluids • Body composition: BMI, DEXA scan, MRI
What can be measured? • Movements of fluids and molecules (cardiac output) • Electrophysiology (ECG, EEG, nerve conduction • Psychometry (cognition, emotional status etc.) • Behaviors • Subjective outcomes such as quality of life and satisfaction with care
Types of Measurement Scales • Qualitative: • Nominal, unordered, categorical, dichotomous or polychotomous • Ordinal or semi-quantitative (Likert scale) • Quantitative: • Ordered discrete with intervals that are integers: number of cigarettes smoked • Continuous: ordered continuous intervals: weight, BP, etc.
Quality of Measurement: Validity Validity is the degree to which the variable you are measuring actually accurately measures the phenomenon you are interested in.
Validity • Face Validity • How well the measure works based on intuitive judgment? Does it make sense that it should be measured this way? • Sampling validity • How well does the measure represent the aspects of the phenomenon you are interested in? • Is time-to-run one mile a good measure of cardiovascular health?
Construct Validity • How well does the measure conform to our current theoretical models or concepts of the phenomenon? • Which biomarker is the best estimator of level of smoking? • Which lab test best reflects vulnerability to opportunistic infections? • Which lab test best reflects our current understanding of the biology of stress? • Levels of what hormone indicate that a patient is in menopause?
Criterion-Related Validity • Correlational validity. Does your measure correlate well to a widely accepted criterion or “gold standard” • Does your self-report stress scale correlate with other known measures of stress? • Can your assay for viruses produce the correct results when you use it to test a known amount of virus? • Predictive validity. A variable’s ability to predict outcomes. • Does your depression index predict suicide? • Do levels of a serum tumor maker predict cancer recurrence?
Convergent Validity • Acceptance of the variable is based on multiple lines of evidence • Low density lipoprotein cholesterol has been validated to measure the risk of atherosclerosis by: • Histopathologic studies of diseased tissues • Epidemiologic studies of populations and families • Multiple animal models • Interventional studies with lipid lowering agents
Quality of Measurement: Accuracy and Precision • Accuracy: The degree to which a variable agrees with a reference or “gold” standard or is free of systematic error (bias). • Precision (reliability): The degree to which the variable is reproducible, or is free from random error.
Relationship of Precision and Accuracy:The target shooting analogy Random - + - + Systematic+ - - + error error
Selecting Measures for Your Study • Find standardized measures of established validity, if available, but use a technique only if it captures the phenomenon you are interested in (construct validity). • Consult with experienced experts about applying an established measure or designing a new measure for your specific purpose. • Pilot the measure for practice and assessment of validity, accuracy, and precision.