Download
1 / 25
280 likes | 835 Views
Cross-Sectional Studies and Measures of Disease Occurrence and Association. by: Dr. Dick Menzies June 13 th , 2005. Cross-Sectional or Prevalence Studies. The basic concept of this study is that it is a snap shot of disease and exposures at a single moment in time in a population

E N D
Cross-Sectional Studies and Measures of Disease Occurrence and Association by: Dr. Dick Menzies June 13th, 2005
Cross-Sectional or Prevalence Studies • The basic concept of this study is that it is a snap shot of disease and exposures at a single moment in time in a population • In some ways it could be thought of as a form of case control study since one looks at disease that has already occurred and at exposures in persons with/without disease at the same time. • The main difference is the strategy used to identify controls
Uses 1. Define risk factors for a disease in question • Personal – demographic,Life style • Medical (lipids, BP, other meds) • Environmental or occupational risk factors 2. Define the prevalence of a condition in a population and prevalence of major determinants • This can help to define the true population impact of a determinant or exposure. • Useful for Health policy, planning health services utilization, public health programmes
Limitations of Prevalence Information • Not useful for • Etiologic research (cannot be sure of cause and effect) • Temporal trends – increasing prevalence may reflect greater incidence, or longer duration (better survival), or changes in population (aging, or selective in – or out-migration) • Problems of cross-sectional surveys in general • Higher prevalence may be associated with factors because: • Causes higher incidence of disease =.BAD • Or, cause longer duration (lower mortality) = GOOD
Diseases best studied • Diseases studied should be reasonably common, ie high prevalence • Otherwise will study too many controls without condition • this is inefficient • Chronic disease with long duration (Higher prevalence) • Or, acute disease with very high incidence
Study Population Population can be general - ie without specific exposures, or selected on basis of specific exposures 1. True general population samples • This type of sampling is difficult and so not done commonly: • One method is random digit dialing (telephone list) or random household selection (using mapping technology such as GIS) • Also technique of staged cluster sampling • Must have a complete list of persons, and/or communities from which to select sample
Study Population Proxy of General Population (easier to access) • School populations • Primary school will be more complete than high school • Requires 90-100% of children in school to be representative - but still ignores older, younger, child-less • Certain work-forces - eg Electricians, Nurses • Are not as representative of total population (age, SES, education, healthy worker effect) • But still can be used to study non-occupational determinants - • And useful to study specific occupational determinants (TB)
Study Population - Exposure based selection Workforce Studies • Workforce studies for occupational exposures • eg Asbestos workers and Lung Ca or mesothelioma • Health care workers and TB • But healthy worker effect • And some characteristics might be quite specific to work force Special Populations • Prisoners, military, mental institutions • Useful for studying selected exposures in these populations
Study Population - Sampling • Census survey - means survey all of the population • Feasible if - you are the government • or - you have a small group • If have to sample - how will you do this? • Select sample of units or population groups (cluster sampling) • Need a list of all units, and size of each • Take all persons in selected units • Eg., workers on certain wards in a hospitals or floors in office buildings • Random selection of all workers - then you need a complete list - and a method of random selection
Study methods - Detecting the disease • In a Prevalence survey one sets out to detect/diagnose all prevalent cases of disease • 1. Need a clear case definition because: • Will often detect mild or asymptomatic cases • Impact and importance of these less clear • 2. Need a method to diagnose • Questionnaire - “Have you been diagnosed with …?” • Will this be valid?? • Direct diagnosis - sero-prevalence, diabetes, lipids, TST • Will this be practical, feasible, acceptable • What will it cost? • Is the testing method valid?
Exposure Assessment • The major weakness in cross-sectional studies • If long latency exposure can change or be forgotten • Measuring current exposures most accurate • Or easily remembered and objective • Eg. smoking history • Pregnancies and children • Occupation • Subject to recall bias • Cases with disease remember exposures better • Or have been prompted to remember by their doctors • This can be overcome if measuring disease at time of survey, and questionnaires about exposures are administered before disease status known.
Measures of Disease Occurrence - 1. Prevalence • Prevalence = number of persons with condition or disease at a given point in time • Prevalence is really a ratio • Numerator = number of persons with disease • Denominator = all persons in population • Prevalence can be expressed as: • At a given point in time - eg, January 1st, 2004 • Or on entry to university or military service • Or can be for a period or time, eg., prevalence during medical school or a five year period of time
Specific definitions • Prevalence (P) = Persons with disease/Total population – this is a ratio (NOT A RATE) • Point Prevalence = number of persons with disease at a specific point in time • Period Prevalence = number of persons with disease during a specific period of time • Annual Prevalence = number of persons with disease over one year. • Sero-Prevalence = number of persons with serologic evidence of disease or infection or exposure
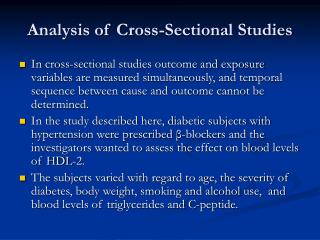
Measures of disease association1. Prevalence Odds Ratio • In a prevalence survey, 60 individuals were found to have diabetes out of 1,000 surveyed • Prevalence of diabetes total = 6% • Prevalence of diabetes among obese persons = 27/200 = 13.5% • Prevalence of diabetes in non obese persons = 33/773 = 4.3%
Prevalence Odds Ratio, cont’d • Express the findings as prevalence odds • i.e., odds of exposure if disease • or, odds of obesity if diabetes = 27/33 = 0.81 • Odds of obesity if not diabetes = 200/740 = 0.27 • Prevalence odds ratio (POR) = 0.81/0.27 = 3.0 • For cross-sectional or prevalence studies the prevalence odds ratio is the same as the ratio of the prevalence of disease in persons with and without the risk factor
Measures of Disease Occurrence - 2. Incidence • The incidence is the number of persons who develop a given disease in a population initially free of disease in a defined amount of time. • Numerator = persons with newly developed disease • Denominator = persons who did not have the disease at the beginning of the period of study • There must be a unit of time • Per week, per month, per year • This gives you a rate. • Births and deaths are a form of incidence • Birth rate, mortality rate
Relationship between Incidence and Prevalence • Prevalence = incidence x duration • This holds ONLY when: • Incidence is stable • Duration is also stable • These conditions are often not true • Eg., HIV – incidence is changing • Duration is also changing with new effective therapy
Measures of Disease Association2. Odds Ratios • Summary measure of disease association in case control studies • General formula: odds of exposure given disease odds of exposure given no disease • This format is used because case control studies identify subjects on the basis of disease status, and then measure exposures
Calculation of Odds Ratio - example • 60 females with lung cancer = cases • 60 females selected without lung cancer = controls • Exposure in question is current smoking
Smokers Non Smokers Totals Lung Cancer (cases) 41 19 60 No lung cancer (controls) 28 32 60 Calculation of Odds Ratio - example • Odds of smoking if cancer = 41/19 = 2.16 • Odds of smoking if no cancer = 28/32 = 0.875 • ODDS RATIO of smoking if lung cancer = 2.16 / 0.875 = 2.5
Measures of Association:2. Risk Ratios • Summary measure of association in Cohort Studies • Formula: risk of disease in persons with exposure risk of disease in persons without exposure • Fundamental concept in cohort studies: • 1. classify persons on the basis of exposure • 2. follow to measure the incidence (or risk) of disease during follow-up.
Calculation of Risk Ratio - example • Cohort at inception: 1,000 people without diabetes • Prevalence of obesity at inception = 22.7% • Outcome: Incidence of diabetes in a population • Exposure - obesity at inception of cohort • Follow-up - six years • Overall incidence of diabetes = 1% per year • Cumulative Incidence = 6%
Risk Ratio Calculation in Cohort StudyExample Ratio of Incidence = risk ratio =27/227 / 33/773 = 12 / 4 = 3.0