Download

1 / 60
700 likes | 1.09k Views
Measure of disease occurrence and its association with exposure. Dr. Premananda Bharati Professor and Head Biological Anthropology Unit Indian Statistical Institute 203, B.T. Road, Kolkata – 700 108 West Bengal, India E-mail: pbharati@gmail.com. Measuring Disease Occurrence.

E N D
Measure of disease occurrence and its association with exposure Dr. Premananda Bharati Professor and Head Biological Anthropology Unit Indian Statistical Institute 203, B.T. Road, Kolkata – 700 108 West Bengal, India E-mail: pbharati@gmail.com
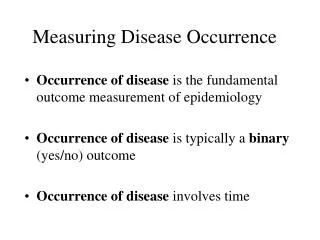
Measuring Disease Occurrence • Occurrence of disease is the fundamental outcome measurement of epidemiology. • Occurrence of disease is typically a binary (yes/no) outcome. • Occurrence of disease involves time. occurrence of disease: the frequency and distribution of diseases and their determinants in the population
Measuring disease occurrence Number of cases of disease Population • Number of cases of a disease in a given population at a specific time • Proportion of the population that had the disease at a given time • Probability of having the disease prevalence
Measuring disease occurrence Number of NEW cases of disease during a period Population at the beginning of the period • Number of new cases of a disease in a given population at a specific time • Proportion of the population that acquires or develops a disease in a period of time • Probability of developing a disease incidence (cumulative incidence)
Measuring disease occurrence Incidence Rate • Proportion of the population that acquires or develops a disease in a period of time • Speed of developing a disease Number of NEW cases of disease Total person-time of observation Denominator: - is a measure of time - the sum of each individual’s time at risk and free from disease
Time-person Person 1 3 l Person 2 x 4 l Person 3 6 l x 3 Person 4 l x 1 Person 5 l Person 5 5 l 22 p.y 2003 2004 2005 2006 2007 2008 2009 Cumulative Incidence = 3 cases / 6 persons = 50% Incidence Rate = 3 cases / 22 person-years = 0.14 = 14 cases / 100 person-years
Cumulative incidence during an outbreak Expressed for the entire epidemic period, from thefirst to the last case Not really a rate but a proportion! Measuring disease occurrence Attack Rate:The number of cases of disease in a specific population divided by the total population at risk for a limited time period, usually expressed as a percentage. • Outbreak of cholera in country X in March 1999 • Number of cases 490 • Population 18,600 • Attack rate 2.6%
Which Disease if More Important to Public Health? Measure of Disease Occurence Number of Ill persons (new cases) Population at risk exposed Attack rate = Attack rate is a Cumulative Incidence; it shows the risk (probability) of disease to occur in a population In regard to risk, measles is the most important disease to public health while rubella being the least
Measuring disease occurrence Descriptive Prevalence Incidence Probability of having the disease Probability of developing the disease Burden RISK
Risks, Odds and 2x2 tables Risk of being a case in exposed = a / (a+b) Risk of being a case in non exposed = c / (c+d) Odds of exposure among cases = (a/(a+c))/(c/(a+c))= a/c Odds of exposure among non cases = (b/(b+d))/d/(b+d))= b/d
Prevalence vs Incidence • Prevalence • Burden of disease -> public health planning • Incidence • Trends over time -> public health implications • Fundamental for studies of causality • Exclude prevalent cases to focus on causes of disease, not on causes of “survival with disease”
Two Types of Prevalence • Point prevalence - number of persons with a specific disease at one point in time divided by total number of persons in the population • Period prevalence - number of persons with disease in a time interval (eg, one year) divided by number of persons in the population • Prevalence at beginning of an interval plus any incident cases • Risk factor prevalence may also be important
Incidence or Prevalence? HIV/AIDS infection rates drop in Uganda Infection rates of the HIV/AIDS epidemic among Ugandan men, women and children dropped to 6.1% at the end of 2000 from 6.8% a year earlier, an official report shows…the results were obtained after testing the blood of women attending clinics in 15 hospitals around the country.
Cumulative Incidence • Definition: The proportion of individuals who experience the event in a defined time period (E/N during some time T) = cumulative incidence • Example: Diabetic medications and fracture: “The cumulative incidence of a first fracture among women reached 15.1% at 5 years with rosiglitazone, 7.3% with metformin, and 7.7% with glyburide.”
Example of Incidence Rate The number of events divided by the amount of person-time observed (E/NT) = incidencerate or density (not a proportion) • Example: “The incidence of a first fracture among women was 2.74 per 100 patient-years with rosiglitazone, 1.54 per 100 patient-years with metformin, and 1.29 per 100 patient years with glyburide.”
Cumulative Incidence • Most intuitive measure of incidence since it is just proportion of those observed who got the disease • Proportion=probability=risk • Basis for Survival Analysis • Two primary methods for calculating • Kaplan-Meier method • Life table method
Cumulative Incidence vs Proportion with Fracture • The cumulative incidence of a first fracture reached 15.1% at 5 years with rosiglitazone, 7.3% with metformin, and 7.7% with glyburide. Takes into account follow-up time. • “Among the 1,840 women, 111 reported a first fracture: 60 (9.3%) of those treated with rosiglitazone, 30 (5.1%) of those treated with metformin, and 21 (3.5%) of those treated with glyburide.” The numbers of cases reported in this is useful but the proportions are not. Does not take into account follow-up time.
Calculating cumulative incidence with differing follow-up times • The Problem: Since rarely have equal follow-up on everyone, can’t just divide number of events by the number who were initially at risk • The Solution: Kaplan-Meier and life tables are two methods devised to calculate cumulative incidence among persons with differing amounts of follow-up time
Cumulative incidence with Kaplan-Meier estimate • Requires date last observed or date outcome occurred on each individual (end of study can be the last date observed) • Analysis is performed by dividing the follow-up time into discrete pieces • calculate probability of survival at each event (survival = probability of no event)
Calculating Cumulative Incidence • Probability of 2 independent events occurring is the product of the probabilities for each occurring alone • If event 1 occurs with probability 1/6 and event 2 with probability 1/2, then the probability of both event 1 and 2 occurring = 1/6 x 1/2 = 1/12 • Probability of living to time 2 given that one has already lived to time 1 (i.e. conditional on survival to time 1) is independent of the probability of living to time 1
Cumulative survival calculated by multiplying probabilities for each prior failure time: e.g., 0.9 x 0.875 x 0.857 = 0.675 and 0.9 x 0.875 x 0.857 x 0.800 x 0.667 x 0.500 = 0.180
Kaplan-Meier Cumulative Incidence of the Outcome • Cannot calculate by multiplying each event probability (=probability of repeating event) • (in our example, 0.100 x 0.125 x 0.143 x 0.200 x 0.333 x 0.500 = 0.0000595) • Obtain by subtracting cumulative probability of surviving from 1; eg, (1 - 0.180) = 0.82 • Since it is a proportion, it has no time unit, so time period has to be added; e.g, 2-year cumulative incidence
“The cumulative incidence of a first fracture reached 15.1% at 5 years with rosiglitazone, 7.3% with metformin, and 7.7% with glyburide.”
Life Expectancy Example: for a mortality rate of .0267 per year
Tuberculosis and Age Per 100 000 Age group, years
Tuberculosis Rate by Age Per 100 000 1927 1947 1980 Age, years
Measures of Association Absolute Risk difference Relative Risk ratios Odds ratios exposed - unexposed exposed / unexposed
Measures of Association The relative risk of myocardial infarction in men compared with women is : 5 Riskmen 5 cases/1000 PY Risk ratio = = = 5 1 case/1000 PY Riskwomen • The absolute risk difference between men and • women is : 4 cases/1000 PY • 5 cases/1000 PY - 1 case/1000 PY = 4 cases/1000 PY
Association Statistical relationship between two or more events, characteristics, or other variables Statistical relationship between exposure and disease Association is not causation!
Risk Factor A factor (exposure) found to be associated with a health condition an attribute or exposure that increases the probability of occurrence of disease behaviour genetic environmental social -- time -- person -- place
Measures of Association Relative risk Odds ratio Attributable risk/population attributable risk percent Standardized mortality ratios
2 x 2 Table Used to summarize frequencies of disease and exposure and used for calculation of association Disease Yes Total No Exposure Yes a b a + b No c c + d d Total a + c b + c a + b + c + d a- =number of individuals who are exposed and have the disease b = number who are exposed and do not have the disease c = number who are not exposed and have the disease d = number who are both non-exposed and non-disease
2 x 2 Table Used to summarize frequencies of disease and exposure and used for calculation of association Disease Yes No Total Exposure Yes (exposed) a b total # exposed No (unexposed) c d total # unexposed Total total # with disease total # with no disease Total Population
Case-Control Study 100% of diseased individuals sampled 25% of disease-free individuals sampled p1 = 8 / 31 = 0.26 ≠ 0.08; p0 = 32 / 249 = 0.13 ≠ 0.036 RR = p1 / p0 = (8/31) / (32/249) = 2.01 ≠ 2.25 OR = (8 x 217) / (23 x 32) = 2.36
Relative Risk The ratio of the risk of disease in persons exposed compared to the risk in those unexposed Often, a measure of association between incidence of disease and exposure of interest Incidence rate of disease in exposed = RR Incidence rate of disease in unexposed
Disease Yes No Total Exposure Yes a b a + b No c d c + d Total a + c b + c a + b + c + d a / (a + b) = Relative Risk c / (c + d)
Relative Risk Incidence in smokers = 84/3000 = 28.0 Incidence in non-smokers = 87/5000 = 17.4 Relative risk = 28.0/17.4 = 1.61
Interpretation of Relative Risk 1 = No association between exposure and disease incidence rates are identical between groups > 1 = Positive association exposed group has higher incidence than non-exposed group < 1 = Negative association or protective effect non-exposed group has higher incidence example: .5 = half as likely to experience disease
A relative risk of 1.0 or greater indicates an increased risk A relative risk less than 1.0 indicates a decreased risk
Measures of Association:2. Risk Ratios Summary measure of association in Cohort Studies Formula: risk of disease in persons with exposure risk of disease in persons without exposure Fundamental concept in cohort studies: 1. classify persons on the basis of exposure 2. follow to measure the incidence (or risk) of disease during follow-up.
Risk Ratio Calculation in Cohort Study Ratio of Incidence = risk ratio =27/227 / 33/773 = 12 / 4 = 3.0
At times, epidemiologists will choose to express disease frequency in terms of odds What are odds?
Measures of Disease Association The chance of something happening can be expressed as a risk and/or as an odds: Risk =the chances of something happening the chances of allthings happening Odds =the chances of something happeningthe chances of itnothappening
Example: If I choose a student randomly from this class, how likely is it that I will choose you?Risk (probability) = 1/9 = .111Odds = 1/8 = .125
Example: Among 100 people at baseline, 20 develop influenza over a year. The risk is 1 in 5 (i.e. 20 among 100) = .2 The odds is 1 to 4 (i.e. 20 compared to 80) = .25 Measures of Disease Association
Odds What are odds? Let p = the probability of an event 1-p = the probability that the event does not occur Odds of the event = p/1-p If the probability of an event is 0.7, the the odds of winning are 0.7/0.3 = 2.33
Odds Ratio The ratio of the odds of a condition in the exposed compared with the odds of the condition in the unexposed Usually applied to prevalence studies rather than incidence studies odds of disease in exposed = OR odds of disease in unexposed
Disease Yes No Total Exposure Yes a b a + b No c d c + d Total a + c b + c a + b + c + d [a / (a + b)] / [1 – (a/(a+b))] = Odds Ratio [c / (c + d)] / [1 – (c/(c+d))]
Odds Ratio Disease Yes No Total Exposure Yes a b a + b No c d c + d Total a + c b + c a + b + c + d [ a / b ] [ ad ] = = Odds Ratio [ c / d ] [ bc ]